Measuring body temperature should seem straightforward, but in ectotherms, the act of measuring can be part of the problem. For especially small amphibians in particular, common approaches like cloacal thermometry require restraint and direct contact, raising the possibility that handling itself alters body temperature before it is even recorded. In this study, we asked a simple but important question: does brief, gentle handling measurably change the body temperature of salamanders?
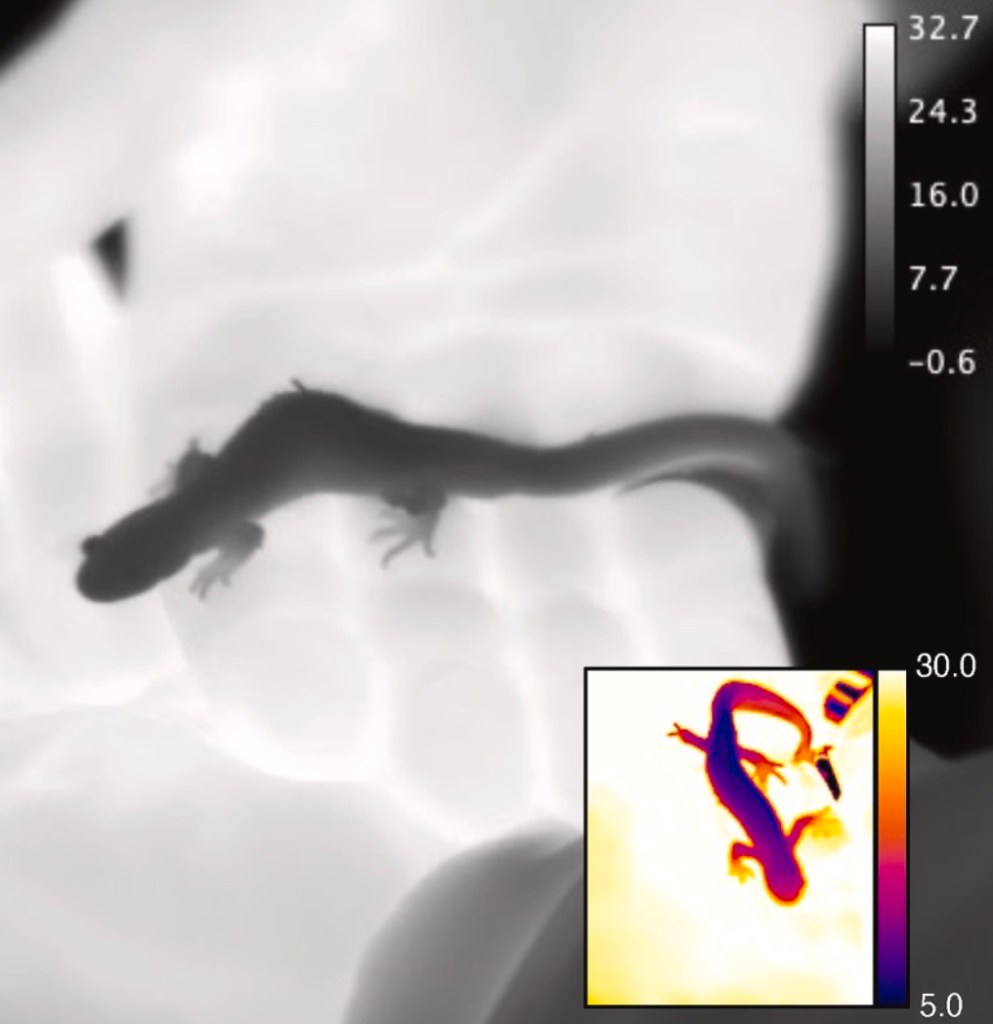
Using infrared thermography, we examined how short periods of handling affected skin temperature in two closely related mole salamanders, the blue-spotted salamander (Ambystoma laterale) and the spotted salamander (A. maculatum). We also combined field measurements with controlled laboratory experiments to tease apart the effects of physical contact, heat transfer, and behaviour.
The answer was clear. Even short handling periods caused salamanders to warm rapidly. In the field, handled animals were consistently warmer than unhandled controls, with the head warming more than the rest of the body. Not surprisingly, smaller salamanders showed larger temperature changes, suggesting body size plays an important role in how quickly heat is gained.
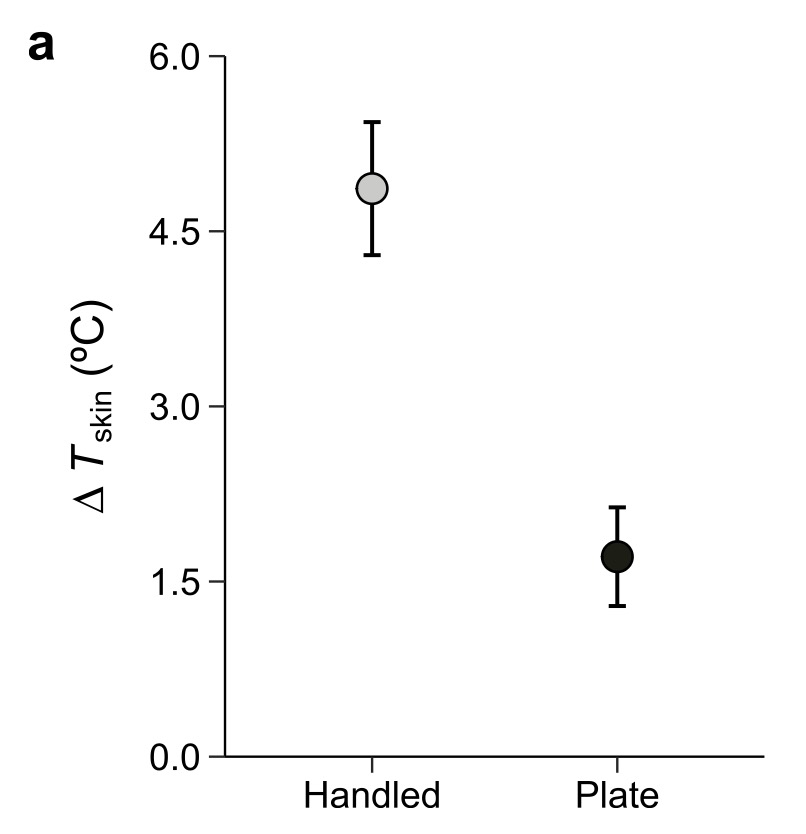
Change in skin temperature of yellow spotted salamanders either handled or placed on a warm plate (set to the same temperature as human handler).
In the lab, salamanders placed on a warm surface (set to hand temperature) also warmed up, but not as much as animals that were actually handled. This tells us that handling is not simply about contact with something warm. While we don’t know precisely why yet, the most likely explanation is that salamanders manifest a stronger cardiovascular response to human handling and the heat that they pick up is transferred more quickly throughout the body.
Temperature changes matter from a behavioural perspective. Warmer salamanders were more likely to become active, regardless of whether that warmth came from handling or from contact with a warm surface. That means handling can influence not only the temperature we measure, but also the behaviour we observe. Taken together, these results highlight a subtle but important issue: brief handling can rapidly alter body temperature, sometimes at rates comparable to experimental heat stress studies. For researchers, this has implications for data accuracy in thermal biology. More broadly, it is a reminder that even well-intentioned, gentle handling can have unintended physiological effects, especially for small ectotherms.
Some caveats: this study is not to be interpreted as alarmist. Warming up from being in contact with warm temperatures is a pretty obvious expectation. These results would only have possible impacts for studies concerned with accurate temperature measurements or those that perform very brief behavioural observations during or immediately after handling (which is probably very rare) that are temperature dependent. And as one of the reviewers of the manuscript rightly pointed out, we measured surface temperatures, which will differ and lag with core temperature measurements.
We do note that there is a related study appearing in the same issue of the Journal of Thermal Biology highlighting similar cautions as this one, and that particular study actually measures core temperature of really tiny frogs!
Citation
Giacometti, D, Montes, LF, Denommé, M, Andrade, DV, and Tattersall, GJ. Handle with care: the thermal consequences of short-term handling in mole salamanders. Journal of Thermal Biology, 136: 104390. https://doi.org/10.1016/j.jtherbio.2026.104390
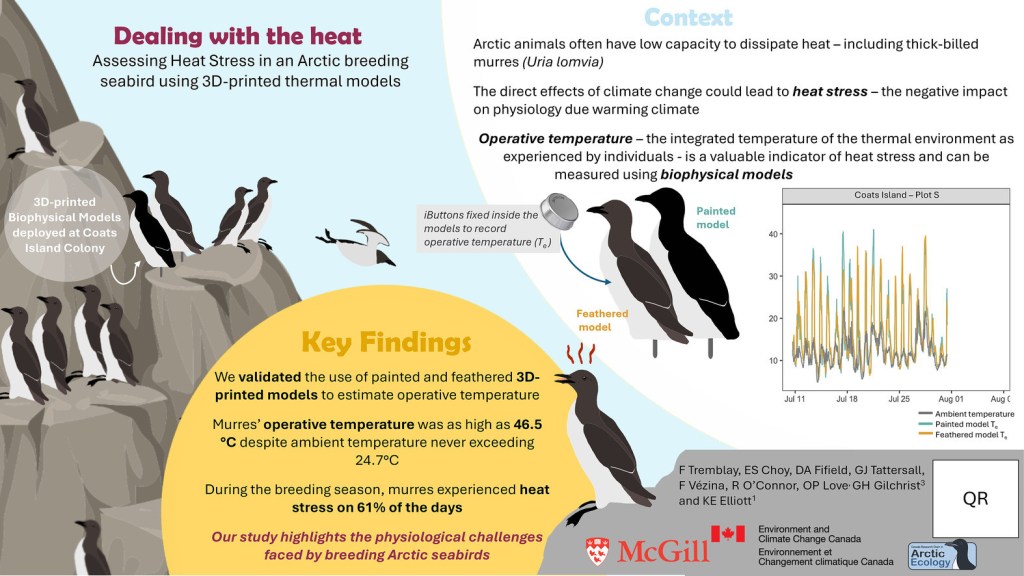
As the Arctic warms at an alarming pace, we’re learning that even cold-adapted species like the thick-billed murre aren’t immune to rising temperatures. This latest study, led by Fred Tremblay from Dr. Kyle Elliot’s lab at McGill adds to the growing understanding that cliff-nesting seabirds are experiencing heat stress far despite ambient air temperatures rarely exceeding 25°C. Using custom 3D-printed murre models painted to mimic the birds’ plumage, we measured “operative temperatures” (the actual heat experienced by an animal) on Coats Island, Nunavut. These operative temperatures soared as high as 46.5°C due to solar radiation and other environmental factors. In fact, murres faced heat stress conditions on 61% of summer breeding days, which can lead to significant water loss and physiological strain.
This work highlights the impact of climate change on Arctic wildlife and illustrates the value of biophysical modelling and how important it is to consider more than air temperature measurements in macroecology/macrophysiology (see https://doi.org/10.1111/1365-2656.12818 and https://doi.org/10.1002/ece3.5721).
These models, in combination with infrared thermal imaging, offer a non-invasive and cost-effective way to measure real-world thermal conditions, paving the way for better predictions of species vulnerability. With males incubating eggs during the hottest parts of the day, this heat stress isn’t just theoretical. It could shift breeding success, survival rates, and long-term population dynamics. These type of studies demonstrate the importance of microclimates in assessing the threats facing Arctic fauna and animals around the world.
Example thermal image of biophysical models and live thick-billed murres in the breeding colony at Coats Island, Nunavut, Canada. For each model and murres where at least 1/3 of the back is visible, the back area is indicated by the white perimeter with associated mean back temperature to the right.Graphical abstract of the study
For access to the study please follow the link in the citation below.
Citation
Tremblay F, Choy ES, Fifield DA, Tattersall GJ, Vézina F, O’Connor R, Love OP, Gilchrist GH, Elliott KH. 2025. Dealing with the heat: Assessing heat stress in an Arctic seabird using 3D-printed thermal models. Comp Biochem Physiol A Mol Integr Physiol. 306: 111880. https://doi.org/10.1016/j.cbpa.2025.111880
For amphibians, water is everything. Their thin skin makes them especially vulnerable to drying out, so staying hydrated is not just about comfort—it is about survival. But how do amphibians manage their hydration state in the face of different temperatures and fluctuating humidity?
Our recent study on spotted salamanders (Ambystoma maculatum) provides some new insights into this question. We exposed salamanders to two temperatures—17°C and 22°C—within a humidity gradient (Fig 1) to understand how salamanders behaved when given the choice to move toward more or less humid conditions under contrasting thermal conditions.
Figure 1. Schematic of the humidity gradient, showing how salamanders can freely move throughout a circular environment to select from low to high humidity.
We found that salamanders consistently selected localities in the gradient that maintained a constant vapour pressure deficit (VPD), which is the key variable driving evaporative water loss (Figure 2). VPD reflects a more physiologically relevant metric for the “drying power” of air. Since they behaviourally regulate a constant VPD regardless of temperature, this provides support for a humidistat (i.e., that they regulate their water loss).
Figure 2. Summary of the selected VPD and selected RH for spotted salamanders tested at 17 and 22C.
Virtually, what this means is that salamanders prefer higher relative humidity (RH) at 22°C than at 17°C to offset the increased drying power of the air at warmer temperatures. This suggests that salamanders are not just responding to RH or temperature independently. Instead, they are tuning into the combined effects that actually influence water loss.
Additionally, salamanders that selected higher VPDs (i.e., dryer conditions) lost more water, and body size also mattered, as larger individuals lost more water than smaller ones even after accounting for temperature. This highlights a trade-off between body size, humidity preference, and the risk of dehydration.
Temperature also played an important role in rehydration. Salamanders rehydrated faster at 22°C than at 17°C, suggesting that warmer conditions may boost water uptake—perhaps because of increased skin permeability at warmer temperatures, or from active processes that promote water uptake.
One of the most intriguing findings was the idea that salamanders might be able to sense how much water they are losing. We propose that local evaporative cooling of the skin—especially on the parts exposed to air—could serve as a sensory cue. If the dorsal skin is cooler than the ventral skin (which stays in contact with the moist substrate), that temperature difference might help the salamanders detect and respond to evaporative demand.
Overall, our study shows that rather than being passive victims of their environment, salamanders actively choose conditions that help them stay hydrated. Their behaviour is not random—it is a targeted response to complex environmental pressures.
One take home from this is that we can’t only measure relative humidity as an environmental predictor for microhabitat selection in salamanders and other ectotherms, but we need to incorporate the biophysical aspects of water loss. Hopefully this isn’t too scary!
Here’s Spotty! – All drought and no rain make salamanders insane.
Giacometti, D and Tattersall, GJ. 2025. Behavioural evidence of a humidistat: a temperature-compensating mechanism of hydroregulation in spotted salamanders. Journal of Experimental Biology, 250297 https://doi.org/10.1242/jeb.250297
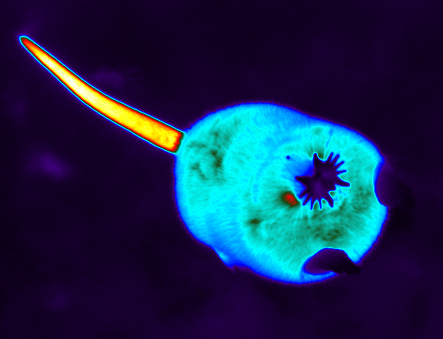
Our study on star-nosed moles was recently accepted in the Journal of Experimental Biology! In it we (myself and Kevin Campbell from University of Manitoba) present on a curious observation that the fleshy, tentacled nose of the star-nosed mole does not show much evidence for elevated blood flow, even when the moles encounter warm temperatures. Indeed, the highly mechanosensitive nasal rays of the star-nosed mole thermo-conform closely with ambient temperature thereby minimizing heat loss without apparent changes in sensory performance. Because this was a non-invasive study, we have to use thermo-conformation as a proxy for blood flow, and discover that they really don’t have high blood flow to the rays!
Abstract of the study
The star-nosed mole (Condylura cristata) is renowned for its densely innervated 22 appendage star-like rostrum (‘star’) specialised for tactile sensation. As a northerly distributed insectivorous mammal exploiting aquatic and terrestrial habitats, these vascularized nasal rays are regularly exposed to cold water and thermally conductive soil, leading us to ask whether the star surface temperature, a proxy for blood flow, conforms to the local ambient temperature to conserve body heat. Alternatively, given the exquisite sensory nature of the star, we posited that the uninsulated rays may be kept warm when foraging to maintain high mechanosensory function. To test these hypotheses, we remotely monitored surface temperatures in wild-caught star-nosed moles. While the tail acted as a thermal window exhibiting clear vasoconstriction/vasodilation, the star varied passively in surface temperature, with little evidence for thermoregulatory vasomotion. This thermoconforming response may have evolved to minimize conductive heat loss to the water or wet soils when foraging.
Note: WordPress may have mangled the videos. Looking into fixing….
Bottom view of the star-nosed mole searching the ground with its star. Blink and you’ll miss it.
Bottom view of a star-nosed mole foraging on an earth worm. One of the world’s fastest eaters!
A rare video / timelapse of a star-nosed mole standing still. In this case it is grooming. This is the only time we observed the star showing any evident “body heat” warming up the star itself. Watch up to the end to see the brief vasodilation to the star before the mole walks off scene. Usually the star remains at or slightly below ambient temperature.
Backstory
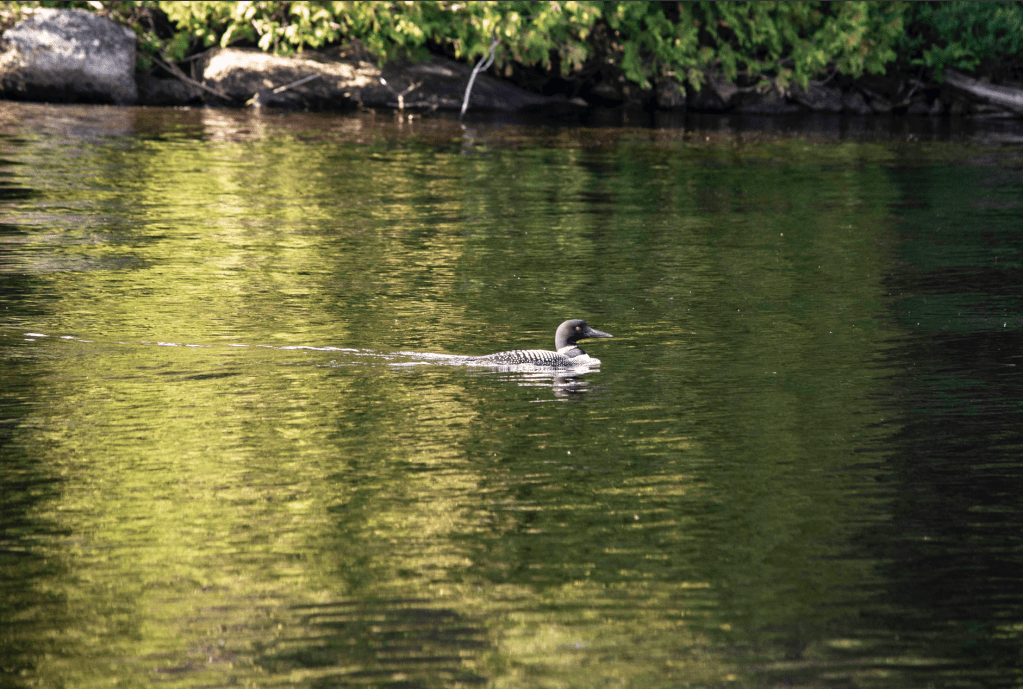
This work took place in Northern Ontario in the summer 2022, as the first sabbatical project I took on board this past year. Kevin Campbell was hosting two film crews out at his field site, and invited me to “tag along” (i.e. research) with the group. My lab been interested in the inter-play between temperature and sensory functions (plus a 4th year course I teach concerns neuro-ethology and sensory ecology/physiology, so this was a fun way to explore teaching/research overlap). Best (and only) two weeks I have ever spent working in a garage/film set. Also, no trip to northern Ontario would be complete without a picture of the resident loon from the cottage.
Citation
Tattersall, GJ and Campbell, KL. 2023. Thermoconforming rays of the star-nosed mole. J Exp Biol 2023; jeb.245127. https://doi.org/10.1242/jeb.245127
We thank Josh Campbell for assistance with mole capture, and the British Broadcasting Corporation Studios Natural History Unit for accommodating this study. This research was supported by NSERC Discovery Grants to GJT (RGPIN-2020-05089) and KLC (RGPIN-2016-06562) and an NSERC Research Tools and Instrumentation Grant to GJT (NSERC RTI-2021-00278).
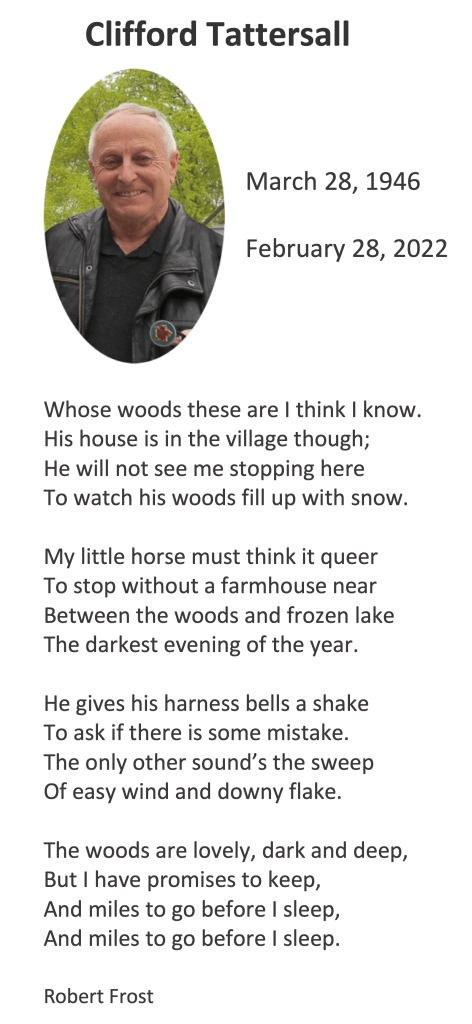
Everyone has an origin story. Every child has a parent, destined at some time to be separated from them. It grieves me to say that my father passed away on 28th February, 2022 and the only way I can think to honour his memory is to share the Eulogy I wrote to shed some light on my origins and to share his family’s grief. Also, for those unable to attend his funeral service today (March 5th, 2022), I hope these words remind you of him and might bring a smile to your face.
Our father was an irascible but lovable character. Often the centre of the conversation, he was quite at ease as the agitator in any discourse, approaching life with an unparalleled inquisitive zeal. At any moment he might have appeared to waver from sarcastic to serious, and to summarise his traits would require me to acknowledge he was both funny and critical, political and knowledgeable, open and secretive, stubborn and generous, kind and strict, but mostly, dedicated and selfless, to the end.
While tempted to speak about how much he meant to his family and how he shaped us and how we will miss him, I would better honour him by describing his life and how his life had meaning to others.
Clifford immigrated to Canada as a child, twice, as he liked to put it. The first time (in 1954), when he was 7, he moved here with his sister Valerie and parents, Doris and Harold Tattersall, from Lancashire, England. His father had taken up a farm manager’s job, lured by the promises of a better life in Canada, presumably from promotional material circulating in the newspapers and town halls of northern England. Despite the many stories he told us of his early life moving from different towns in Southern and Eastern Ontario, we never tired to hear them. They were the standard farm life stories of early morning milking, living on scraps of food, and the trials and tribulations of rural life….Life was hard, and they were poor. Indeed when asked of his lack of middle name, his favourite response was that middle names were too expensive when he was born, in post-war, Northern England.
For reasons best lost to history, he says he was sent back to England to live with his grandmother at the age of 12, ostensibly to prepare for his family’s return to England (had they tired of the frontier life?) ….except, instead, his own parents chose to simply remain in Canada! So, a year later, like a child out of an O’Henry story, he was returned to Canada and therein spent the rest of his life.
Some time after his return, he and family settled in St. Catharines, and eventually my dad met my mother, Brenda Bernard, as they both lived in Port Dalhousie. His parents owned the local variety store, Lakeview Variety, better known as “Mr. and Mrs.’ T’s” that pre-dated the rise of the Avondale stores, and thus most people in the neighbourhood knew one another with the store as the central hub. Indeed, that is where my parents met! Clifford and Brenda married in 1969 on what I imagine was a beautiful spring day in April, although sadly I am told, it was cold and wet!
Following a few years working in sales for local industry, my father embarked on a federal government career initially as a flight service specialist at Toronto Airport and later working as a radio operator for Transport Canada and finally the Canadian Coastguard. This career brought us, as a family, to all corners of Ontario: Sarnia in the southwest, Earlton in the North, and Wiarton in the middle. During those years in Wiarton, my dad wanted to have a hobby farm, allowing us all to re-live his childhood (his words!). Small ideas at first. A few chickens for eggs, a cow for milk, a horse for riding. It wasn’t long before this hobby farm grew to a second full time job, with 30 cattle, 3 horses, 30 chickens, 5 pheasants, and yearly wood chopping, hay baling, grain seeding, rock picking, and all the trials and tribulations of farm life. The concept of doing things in moderation was alien to my father.
In the last 10 years of his career, after selling the farm and moving back to Niagara, dad continued his career meanderings on his own. Downtown Toronto for 2 years, Sydney, Nova Scotia for 2 years at the Coast Guard College, Sault Ste. Marie as station manager, back to Sarnia as manager and technical trainer, and eventually all the way to Inuvik in the North West Territories as manager of the marine radio station for his final few years until retirement. While we couldn’t join dad on all these adventures, we felt that we lived them with him over the years through his regular conversations about the people he worked with. My father was certainly known for work ethic and his gift of the gab. Rarely was he not busy getting something done around or on the phone or facetime catching up with someone.
Following his retirement in 2005, he returned to Southern Ontario from all his northern journeys and wanted to take up a hobby. For a time, he took this literally, building a train set which allowed him to play toy trains with his grandson. But as always with my dad, there was a connection to yesteryear automobiles, and his train set eventually grew to an antique model car hobby, presumably as he began to remember the cars of his youth. This was not unusual for us. Growing up with my dad invariably involved him spotting a vintage car on the road that he would immediately identify down to year, make, and model within seconds, usually then describing how the taillights differed between the 1957 model vs. the 1958 model and where the vehicle was manufactured. So I suppose it was fate that in his retirement, he took it upon himself to become a vintage car owner, initially with the purchase of a 1937 Oldsmobile that he gradually upgraded over the years. But at his heart, he was always a Studebaker man, so when the chance arose for him to procure one, he drove across the country and borders to acquire his first Studebaker, a beautiful 1955 aqua blue car. He eventually expanded his fleet of Studebakers to 3, including a 1964 and a 1966. Most of his summer months were spent tinkering, fixing, polishing, and generally moving his fleet of Studebakers from winter storage to the various summer garages he managed to “borrow” from friends and family. I know that his retirement involved a network of new friends and acquaintances met at swap meets, car shows, and drivers clubs that have supported him during these last few years.
From my own perspective, I always felt a little conflicted that I lacked his vehicular knowledge and innate automotive enthusiasm, despite being taught by my dad how to ride a bike on an airport runway! It may have seemed I could not fully enter into this part of his life, but he included me in it nonetheless by asking me to provide him with space in my garage for one of his vintage cars. This gave him reason to share his interests with me over the years, and I remember our yearly road trips to Marshville fondly.
We shared other things with our father, that stemmed from our own childhood that he had set in stone for us. A consequence of him raising us on a farm in a rural homestead, we all shared a love of the outdoors, and of the joy of a simple walk in the woods. Indeed, since 2011 we have taken almost daily walks in the St. John’s Conservation area. These early morning forays, often before sunrise, were filled with political discussions (dad’s favourite) or academic rants (my favourite). I think we both listened, in our own ways, although sometimes we only responded to each other days later, after careful contemplation or examination, knowing that we would always have each on another day to continue the conversation. With dad gone, I will miss these cherished ‘examinations’ into our opinions and biases the most.
Socrates claimed that “An unexamined life is not worth living”, and I think my father, although not a philosopher, may have lived by this creed, but with his own unique take. For a non-lawyerly person, my father was very inquisitive – and often to some – inquisitional, sometimes taking a polarising view on topics. At times he seemed to passionately argue about something, and I remember one day I said to dad: “You aren’t really arguing, you just like to question every single topic”, and he looked back at me, almost with delight as if I finally did begin to understand him. Perhaps, in his own way, he understood the claims to examine life as being instructions to examine the lives of others, given how intensely or dogmatically my father would think and pursue the issues of the day. Maybe he wondered whether his own children and family were too close to appreciate him, but I know we did, and I hope he knows that we would not have had him any other way.
While my father certainly had his way of examining truths, he was on a journey that examined the strengths and limits of any human being. On top of all the love, encouragement, memories, and life lessons, we will forever cherish the memory of our father’s zest for inquiry. It is what made us who we are.
Congratulations to Sara Ryding, Deakin University for the first chapter of her PhD thesis being published in Trends in Ecology & Evolution on “Shape-shifting: changing animal morphologies as a response to climatic warming”. Link to the paper here or here.
In this review, Sara writes about how animal appendages (ears, feet, limbs, bills, etc) are important morphological indicators of temperature and therefore potential signatures of changing climate.
Appendages have an important, but often undervalued, role in animal thermoregulation as sites of heat exchange.
This thermoregulatory role leads to geographic clines in animal morphology where animals at lower latitudes, in warmer climates, have larger appendages (a pattern known as ‘Allen’s rule’).
In this review, we discuss evidence for animals (mostly evidence in birds and mammals, although the field does extend to other animal taxa) that are shifting their morphologies to have proportionately larger appendages in response to climate change and its associated temperature increases.
A thermal image of a Galapagos sea lion, showing distinctly warm front flippers. Appendages tend to be variable in size and have capacity to vary peripheral blood flow, and thus may serve as sensitive indicators of changing climate.
It has been a real pleasure to work with Sara Ryding on this project. Full credit and thanks go to Sara for all her hard work on this paper. I helped out only a small bit, but she reviewed the field within which my lab has been conducting collaborative research since 2010. Hopefully more research will follow as she navigates the rest of the project us (Drs. Matthew Symonds and Marcel Klaassen and myself). Many late nights and early morning zoom meetings await us all. Many thanks to Deakin University and the Australian Research Council for supporting this project.
Citation
Ryding, S, Klaassen, M, Tattersall, GJ, Gardner, JL, and Symonds, MRE. 2021. Shape-shifting: changing animal morphologies as a response to climatic warming. Trends in Ecology & Evolution. DOI: https://doi.org/10.1016/j.tree.2021.07.006
Nick Sakich here. The first paper from my MSc has just been published in the Journal of Experimental Biology. The paper is entitled, “Bearded dragons (Pogona vitticeps) with reduced scalation lose water faster but do not have substantially different thermal preferences.”
In it, we examine both “wild-type” bearded dragons and two phenotypes unique to captivity (i.e. not found naturally): animals with scales of reduced prominence (known as “leatherbacks”) and completely scaleless animals (known as “silkbacks”). The following slideshow depicts the 3 variants:
There has long been speculation as to whether or not scales play a role in reducing evaporative water loss across the skin in reptiles. The seminal studies that most point to are by Licht and Bennett (1972) and Bennett and Licht (1975). Those authors looked at aberrant partially scaleless individual snakes found living in the wild and found that they did not have higher rates of water loss than “normal” snakes. However, these studies had some methodological issues, most notably sample sizes of only one (Licht and Bennett, 1972) and two (Bennett and Licht, 1975) partially scaleless snakes, respectively.
Furthermore, can reptiles (or lizards and snakes, at least) detect their rate of evaporative water loss and respond accordingly? If they can, animals with higher rates of evaporative water loss will perhaps choose cooler temperatures compared to animals with lower rates of evaporative water loss. The rate of evaporative water loss is partially thermally dependent, so for the animals this would be a way to compensate and bring their rate of evaporative water loss down.
In this study, we set out to test two hypotheses. First, we hypothesized that scales are indeed a barrier to evaporative water loss, and so leatherbacks and silkbacks would have higher rates of evaporative water loss than wild-types. Second, we hypothesized that, because of this increased rate of evaporative water loss, leatherbacks and silkbacks would have lower thermal preferences than wild-types.
We found support for our first hypothesis: both leatherbacks and silkbacks evaporated water faster than wild-types. It is likely that most of this occurs across the skin, rather than through changes in breathing or metabolism, given the simultaneous measurements we made of metabolism. This confirms what many who keep silkbacks as pets have long suspected. However, we didn’t find a statistically significant difference in thermal preference between the three phenotypes. This suggests that either leatherbacks and silkbacks can’t tell that they’re losing water faster than wild-types, or that they can tell, but they make a strategic decision to prioritize warmth over water.
I’d like to thank Arnold Liendo and Paula Rodriguez, Mandy Peck, and Kirk Riddle for supplying us with lizards for this study. I’d also like to thank Tom Eles and Wynne Reichheld, without whom keeping up with the nuts-and-bolts of animal acquisition and care would have been impossible.
Citation
Sakich, NB and Tattersall, GJ. 2021. Bearded dragons (Pogona vitticeps) with reduced scalation lose water faster but do not have substantially different thermal preferences.Journal of Experimental Biology.224 (12): jeb234427.
A link to the pdf of the manuscript can be found here (limited to 50 clicks). Otherwise, requests for pdfs can be made on Researchgate.
References
Licht, P. and Bennett, A. F. (1972). A scaleless snake: tests of the role of reptilian scales in water loss and heat transfer. Copeia 1972, 702-707. doi:10.2307/ 1442730
Bennett, A. F. and Licht, P. (1975). Evaporative water loss in scaleless snakes. Comp. Biochem. Physiol. A Physiol. 52, 213-215. doi:10.1016/S0300- 9629(75)80155-1
The following is a guest blog by Dr. Joshua Robertson Tabh
In my short research career, I’ve come to accept (even relish) that there are some projects that endlessly surprise; projects with shifting objectives that find you running drive-by thermal camera hand-offs along the QEW at questionable hours. The project that I’m about to describe is one of “those”. And curiously, despite the innumerable twists and turns, it just so happened to be a project with some of the most useful outcomes I’ve helped to produce. In this guest post, I’ll describe those outcomes.
But first, let’s begin in 2016. I had just begun my PhD research in avian stress physiology, and mere months before, Paul Jerem and others had released a highly intriguing protocol which suggested that the physiological stress response could be detected, and possibly quantified, in birds by simply measuring changes in body surface temperature (https://www.jove.com/t/53184/thermal-imaging-to-study-stress-non-invasively-in-unrestrained-birds). The rationale behind their protocol was that following exposure to a stressor, the sympathetic nervous system triggers vasocontriction of blood vessels at the skin (among other things), which manifests as measurable changes in skin temperature. This idea isn’t new. Rather, it likely dates back to the early 20th century or previous (e.g. Wolff and Mittelman, 1937). However, Jerem et al’s protocol was the first to show that a stress-induced change in skin temperature could be detected at the eye region in a wild bird, using infrared thermography (see Edgar et al, 2013, for a study in chickens). A clever application of thermography.
Jerem et al’s work was exciting. But a few important questions seemed to linger:
(1) how well does this stress-induced change in eye region temperature reflect circulating changes in sympathetic nervous system markers (i.e. catecholamines, like adrenaline and noradrenaline)?
So, being nagged by these questions, a team of ecophysiologists (Glenn Tattersall, Gary Burness, and Oliver Wearing), an endocrinologist (Gaby Mastromonaco), and myself sought answers.
To do so, we required an experimental approach that would allow us to measure both body surface temperature (here, at the eye region and bill) and circulating catecholamines in “stressed” and “unstressed” birds. However, measuring circulating catecholamines requires sampling blood. And since puncturing a vein with a syringe is surely sufficient to activate a physiological stress response on its own (thus rendering “unstressed” birds “stressed”) blood sampling by this standard method simply wasn’t possible. Ideally, we would fit a sample of birds with central venous catheters to permit blood sampling without capture and venipuncture. This approach could work, however, even if blood samples were to be collected effectively, catecholamines can be a pain to quantify, even for contracted labs with high-end machinery. It’s for this latter reason that we accepted the reality of leaving our first research question unanswered.
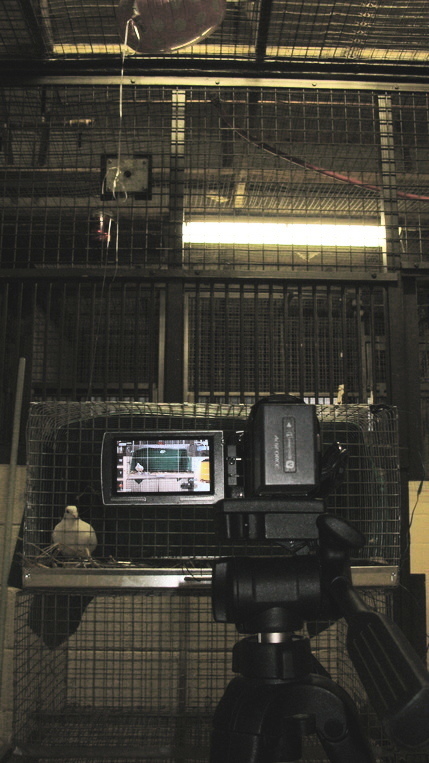
Fig. (1) Domestic pigeon being monitored during rest, before experimentation.
Nevertheless, we could persist with a simple experimental design to answer research questions (2) and (3); quite simply, thermographically image birds during rest (Fig 1) and during a stress exposure (for us, handling). To answer question (2), we would then quantify and compare the magnitude of stress-induced changes at the eye region and bill. And lastly, to answer question (3), we would aim to test the effect of head angle on our ability to detect stress-induced changes in eye region and bill temperature. In theory, a nice and clean approach.
Before I get to the answers of our remaining research questions, a small note on how we estimated head angle (for the interested reader).
Estimating Head Angle from 2D Image
Estimating the orientation of a 3D object from a 2D angle has been a concern for humans since photography was invented. Among mathematicians, this challenge has since acquired a formal name: the “perspective-n-point” (or “PnP”) problem. All solutions to the PnP problem first require knowledge of where, in a 2D plane, at least 3 points in an imaged object lay. We’ll call these points “landmarks”. Of course, more than 3 landmarks are best to improve estimation accuracy, but most agree that 3 will do for a reasonable guess. Next, rough dimensions of the imaged object in 3D space are needed. Such dimensions must be sufficient for one to estimate where the chosen landmarks may lie, relative to each other, in a theoretical 3D co-ordinate system known as the “world co-ordinate system”.
Once this information is collected, several geometrical approaches may be used to calculate how the imaged object must have moved or rotated such that the landmarks in 3D space overlap with those observed in 2D space (after adjusted for lens distortion). Interestingly, there is one industry with considerable investment in creating efficient geometrical approaches: virtual reality (or “VR”) gaming. Why? Because using VR gaming requires that the system can estimate the gamer’s 3D position at all times (with, interestingly, tiny infra-red lights implanted in the headset as landmarks). Thanks to this investment by the VR industry, studies developing and comparing the accuracy of geometrical solutions to the PnP problem are flourishing. It’s a perfect time for biologists like us to start taking a peak at them.
For our study, we chose to use to an approach called the “EPnP” that was first proposed by Lepetit and others in 2009 (https://link.springer.com/content/pdf/10.1007/s11263-008-0152-6.pdf). We chose this approach because it permits one to use >4 landmarks for positional estimation (thus reducing error) with little cost to computational time relative to traditional solutions. Other approaches have been lauded for improving accuracy (e.g. P3P with RANSAC) and we encourage others to pursue those approaches. For our study, however, we were interested in balancing accuracy and efficiency.
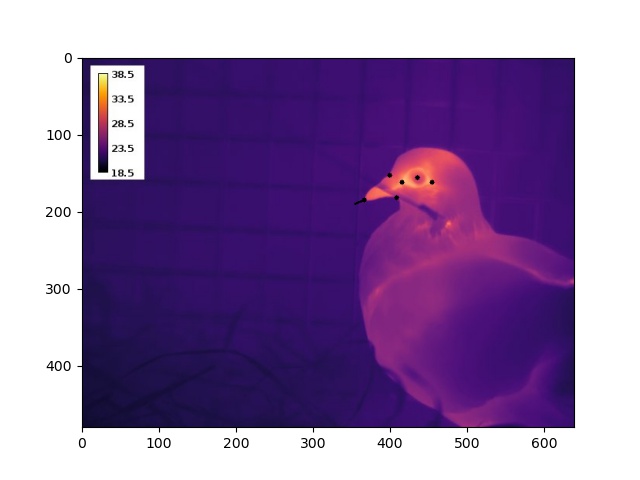
To execute the EPnP approach, we estimated the 2D position of up to 9 landmarks on a pigeon’s head by loading our thermographic images into ImageJ (Fig 2). Building a 3D model turned out to be much less time consuming – simply draw on morphometric measurements of domestic pigeons reported in literature. From these data, and EPnP algorthims, we were thus able to estimate both a 3D translation and 3D rotation of an imaged bird’s head, relative to a virtual model of a perpendicularly facing individual.
Fig. (2) Thermographic image of a domestic pigeon with black dots marking 6 of 9 possible landmarks. The black line at the tip of the bill indicates the estimated direction in which the pigeon is facing.
Our results?
I’ll break them down by question.
Question (1): How well does this stress-induced change in eye region temperature reflect circulating changes in sympathetic nervous system markers (i.e. catecholamines, like adrenaline and noradrenaline)?
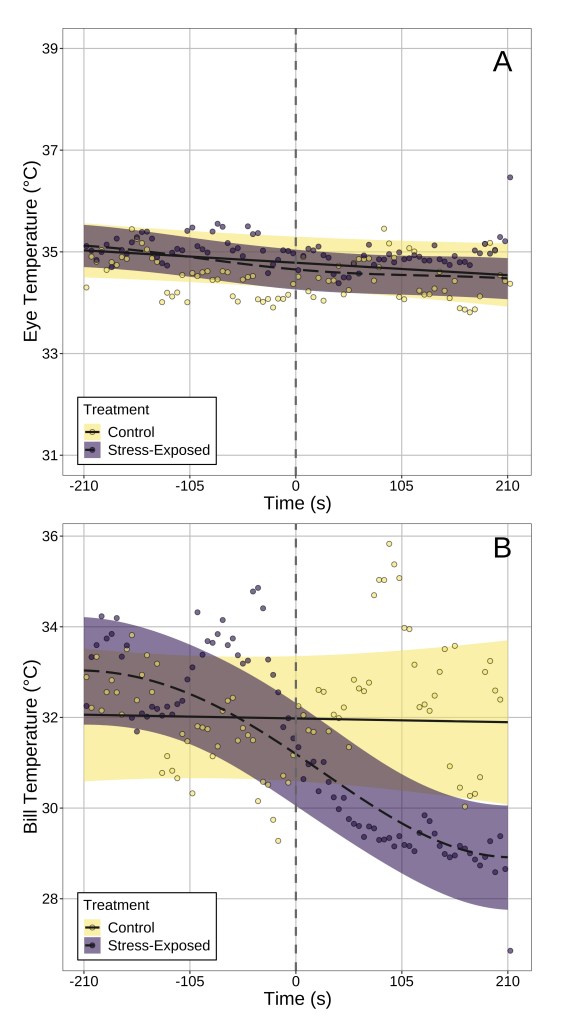
Answer: Our results suggest that, at least in our study species, surface temperature the bill is probably a better indicator of stress physiological state. I’ll explain why by referencing what we observed from data that did not control for head position. After stress exposure, bill temperature fell significantly by ~4°C after stress exposure (handling), while eye region temperature did not significantly change (Fig 3). Rather, temporal patterns in eye region temperature appeared remarkably similar between “stressed” and “unstressed” birds. Moreover, only stress-induced changes in bill temperature showed significant inter-individual variation, suggesting that if one wishes to build a metric of “stress-responsiveness” from changes in surface temperature, doing so at the bill is likely more effective than at the eye region.
Fig. (3) Changes in eye region and bill temperature across time in both stress-exposed and control birds. Time 0 (marked with a vertical dashed line) indicated that time that flight cages were opened to permit capture and handling of birds in the stress-exposed treatment group. Dots represent averages across birds per 5 seconds of observation, and lines of best fit represent trends estimated by generalised additive mixed-effects models. Ribbons represent 95% confidence intervals around trend estimates.
Question (3): How robust and reliably detectable are stress-induced changes in body surface temperature?
Answer: It depends on where you look. After correcting for changes in head position in our birds, a significant effect of stress-exposure on eye region temperature emerged (Fig 4). This was not the case for stress-induced changes in bill temperature, which were detectable regardless of whether head position was accounted for or not. This point, we think, is particularly important for two reasons:
(1) don’t correct for changes in object position and you risk missing out on detecting biological processes, and
(2) surface temperatures of some body regions might be better indicators of your biological process of interest than others.
Fig. (4) Change in eye region temperature of stress-exposed and control pigeons after correcting for changes in head orientation. Again, time 0 (marked with a vertical dashed line) indicated that time that flight cages were opened to permit capture and handling of birds in the stress-exposed treatment group. Dots represent averages across birds per 5 seconds of observation, and lines of best fit represent trends estimated by generalised additive mixed-effects models. Ribbons represent 95% confidence intervals around trend estimates.
Take Home Message
To conclude, drawing biological inference from thermographic images is tricky. Many sources of error can get in the way of your ability to meaningfully do so, and a common one is changes in object position. As such, biologist should always remember to correct for object position when working with their surface temperature data – perhaps by using our method or another.
Tabh, Joshua KR, Burness, G, Wearing, OH, Tattersall, GJ, Mastromonaco, GF. 2021. Infra-red thermography as a technique to measure physiological stress in birds: body region and image angle matter. Physiological Reports, Accepted.https://doi.org/10.14814/phy2.14865
Acknowledgements
Dr. Joshua Robertson Tabh is a graduate of Trent University, co-supervised by Dr. Gary Burness and Dr. Gaby Mastromonaco. This research was made possible with the cooperation of the Toronto Zoo and by the watchful eye of Oliver Wearing. Since 2016, Joshua and Glenn have shared many conversations about avian physiology, imaging, and coding and Glenn invited Joshua to guest author this post after all these efforts finally reached the publication stage.
Funding for this research was provided by the Toronto Zoo Foundation, an NSERC Collaborative Research and Training Experience Program (Grant #: CREATE 481954-2016), a Howard P. Whidden grant to OHW, and an NSERC Discovery Grant to GJT (Grant # RGPIN-2014-05814).
So I usually don’t provide news about me, but this is an opportunity to thank my awesome departmental and faculty colleagues, so I’ll do so here.
I found out today I was awarded a Distinguished Scholar’s Award by my Faculty (Mathematics and Sciences). When your colleagues start emailing you congratulations, I guess you begin to take notice that something is happening. As always, when you read the nice things people say about you, it causes some self-reflection and uncertainty, but I’ll run with the peer recognition and thank my colleagues and acknowledge my own students and various collaborators who are as much part of any recognition as I would be.
Also some good news, my departmental colleague, Dr. Lori MacNeil won recognition for her outstanding teaching, both from the faculty level (Distinguished Teaching Award) and from the students (Math and Science Council Excellence in Teaching & Student Engagement Award). Congratulations Lori. It’s nice when you work with someone and see how they teach and I can attest that this is well deserved!
These are challenging times for everyone, but news like this brightens the day, and I simply want to acknowledge that whomever nominated me for this has themselves to thank as well, since I am working alongside some supportive scholars who care about our students, our research, and our involvement in public work. Clearly, I owe somebody a beer or two.
We’ve been studying gaping behaviours in bearded dragons for a while and one of Ian Black’s (former MSc student) thesis chapters has just been published! A link to the article is here: http://link.springer.com/article/10.1007/s00360-020-01332-y
We devised a simple way to prevent gaping (i.e. temporary and rapidly reversible) and examined how strongly this influenced thermoregulatory behaviours. Interestingly, although it did significantly lower thermal selection / thermal preference behaviour the effect was quite small. We also saw some interesting changes in heat orientation behaviour. Animals that were not able to gape behaved more randomly with respect to postural orientation, whereas the control lizards tend to shy away from orienting to hot temperatures (i.e. the definition of thermoregulation is to exhibit a corrective response when moving outside the set-point range).
Alas, we don’t have any cool images to share from this study, but consider looking at some of our other papers here and here where we have examined evaporative water loss and thermal imaging in bearded dragons.
The article is part of a special issue honouring Dr. Peter Frappell, a friend and colleague in respiratory and thermoregulatory physiology. Thanks Frapps for all your input and support!
Congratulations to Ian Black for getting this published and thanks to Dr. Laura Aedy for her early work on this project.
Citation
Black, IRG, Aedy, LK, and Tattersall, GJ. 2021. Hot and covered: how dragons face the heat and thermoregulate. Journal of Comparative Physiology B, In Press, https://doi.org/10.1007/s00360-020-01332-y