We’re happy to share news that our paper (shareable link) was recently accepted in Methods in Ecology and Evolution! As for the nitty gritty secrets of the study, that headline was to get your attention! I’ll point out some highlights here, with some visuals to summarize the main results.
The study resulted from a visiting PhD student (Núria Montmany-Playà, @NuriaBeachy) to the lab in January 2020, immediately prior to the pandemic and lock-down. Sadly, some of the research we planned to do was not possible due to travel restrictions and embassies immediately calling back their citizens. So, this represents about the only kind of research my lab is capable of doing during a lockdown.
So, what is the paper about? Technically, it’s a methods (thus the journal choice!) and resource paper (information on empirical measurements of emissivity which I often get from colleagues) with a warning to field thermographers to “check your distance“! (Actually, Faye et al 2016 already advised this, but given various interactions I have had over the past few years, some field thermographers might not be reading all the literature – so please read Faye et al’s paper cited at the bottom of this blog).
Distance Effects
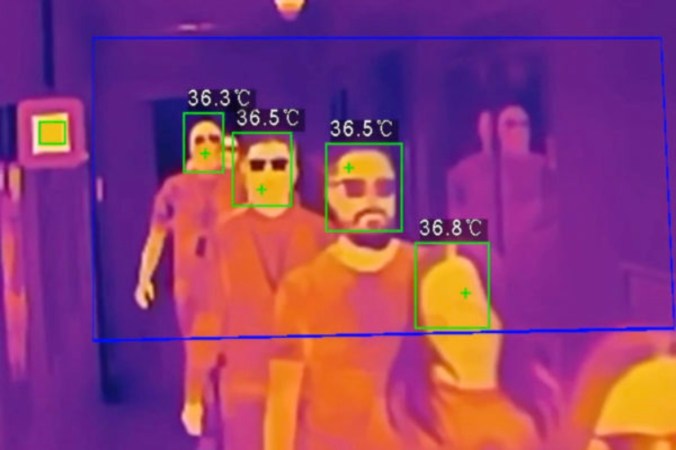
It has become increasing common in some animal thermography studies to capture the maximum temperature from a specific region of the body (often the face or the eye) and use this as an estimate of body temperature (it is not a good estimate!) or as a proxy for vasoreactivity related to stress (which it is a better indicator of, although depends on species and body part). This effect of distance was earlier studied by Faye et al (2016), although we focus on the challenges in animal thermography in the field where animals control how close you can get! Watch the video below for the effect in action, paying attention to the maximum temperature in the eye region and how it changes as this Trumpeter swan walks closer (starting from ~15 m) and closer (~2 m) to the camera:
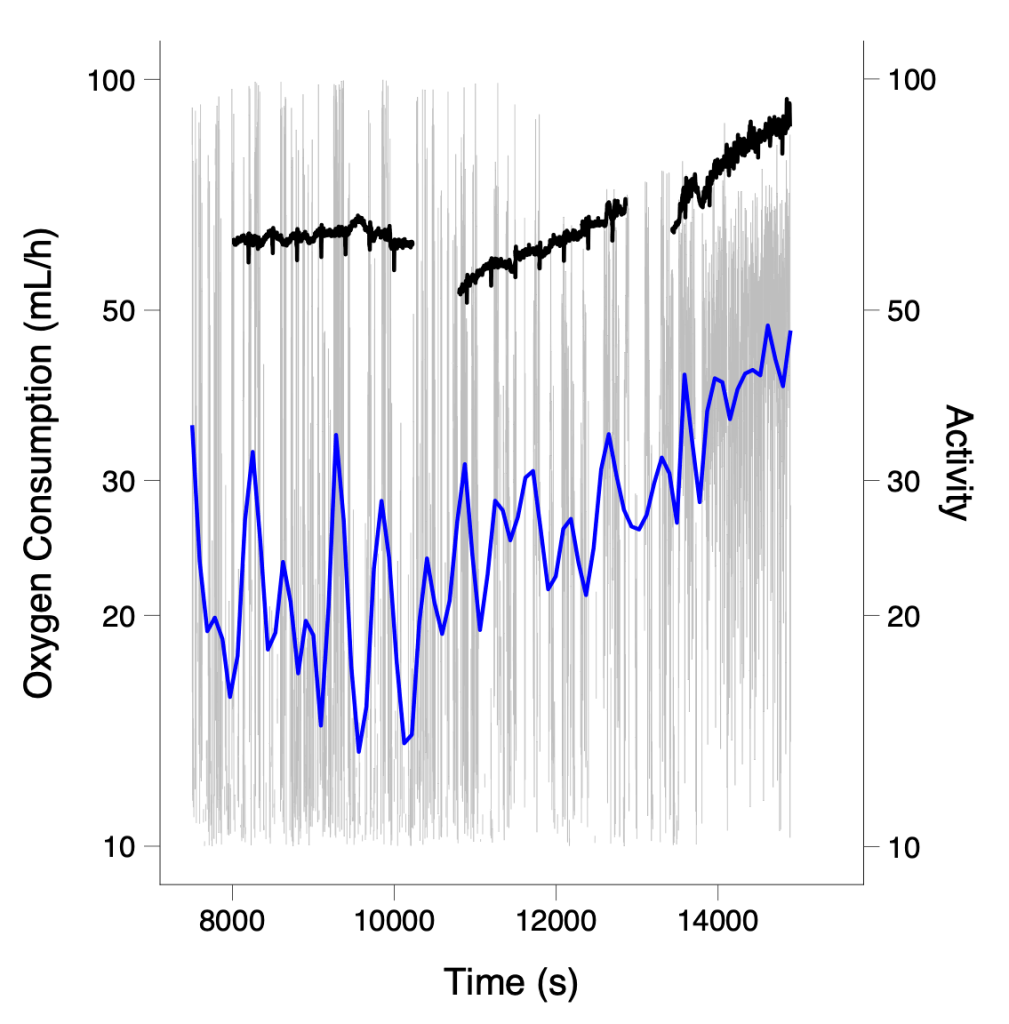
Here are the results plotted over time as an animated plot:
As the bird gets closer, the maximum temperature of the same animal rises from a low of ~25C to reach closer to a more realistic value of ~33C. This is an enormous range and cannot reasonably be based on vasoreactivity, when the physics of thermal optics can explain this. Read the paper for the explanation behind how spot size and distance effects interact to produce fairly large errors in thermography. Controlling for distance and/or being aware of its influences is important to any field application of thermography. I doubt too many people are trying to image animals at 10 m away given the low resolution of many thermal cameras, but as prices come down and people take their devices into the field, I am sure researchers will run into these situations.
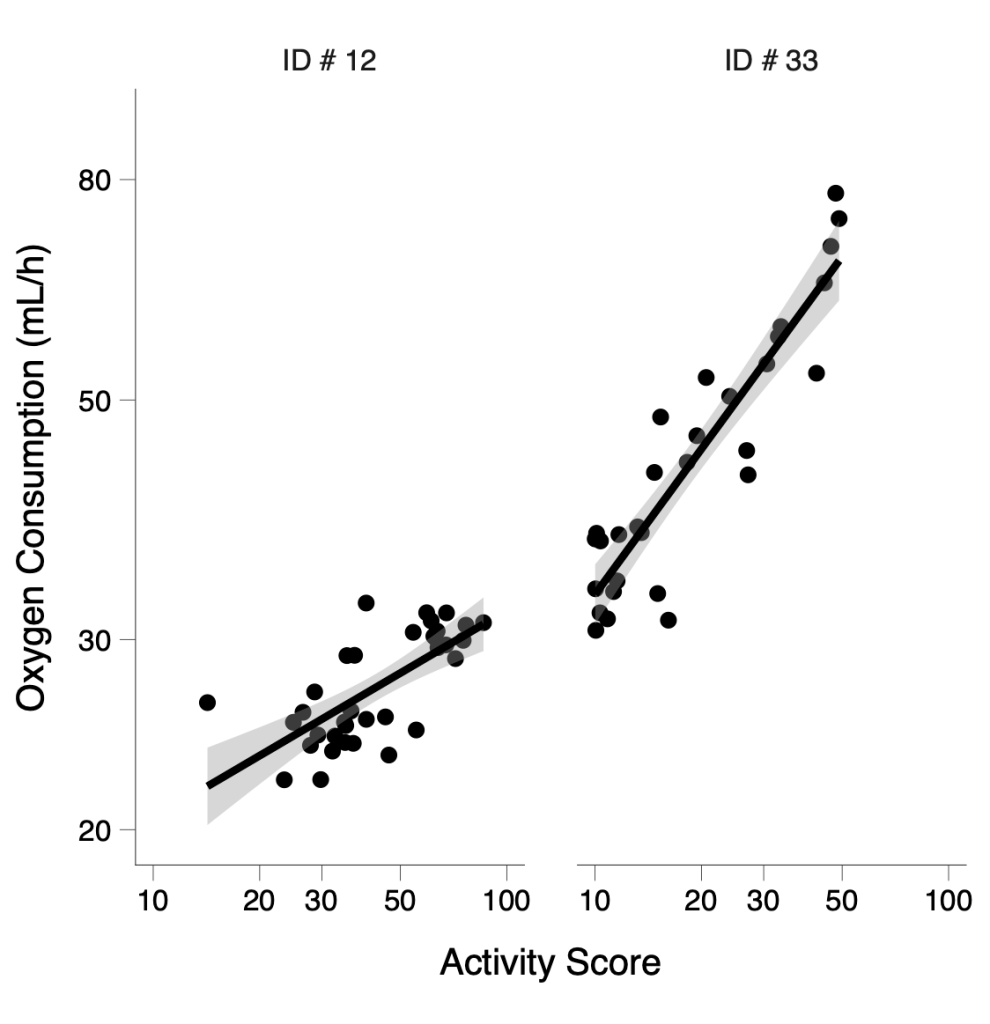
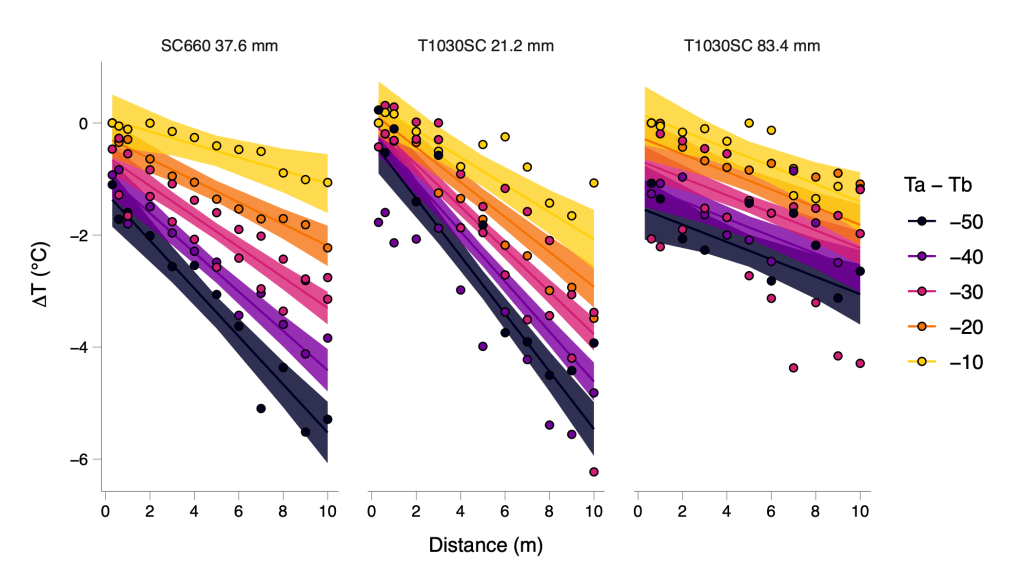
We measured the technical error using a blackbody calibration source placed at different distances from the camera, and tested under different conditions. Below, Tb refers to the blackbody temperature (i.e. true temperature) and Ta refers to prevailing ambient temperature. Delta T refers to how the thermal camera estimates the same black body temperature (where 0 refers to the closest distance measurement). We tested this with different camera/lens combinations to give insight into how the devices function even under well controlled conditions, far different from most field applications. You can see below that the error in temperature can be as poor as 6C below actual temperature at 10 m distance, and these results are for measurements of an electronic calibration source.
Angle Effects

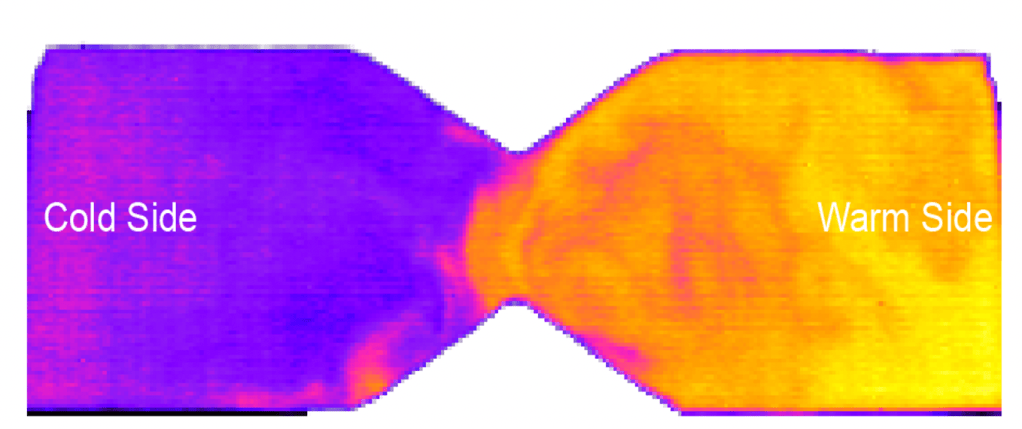
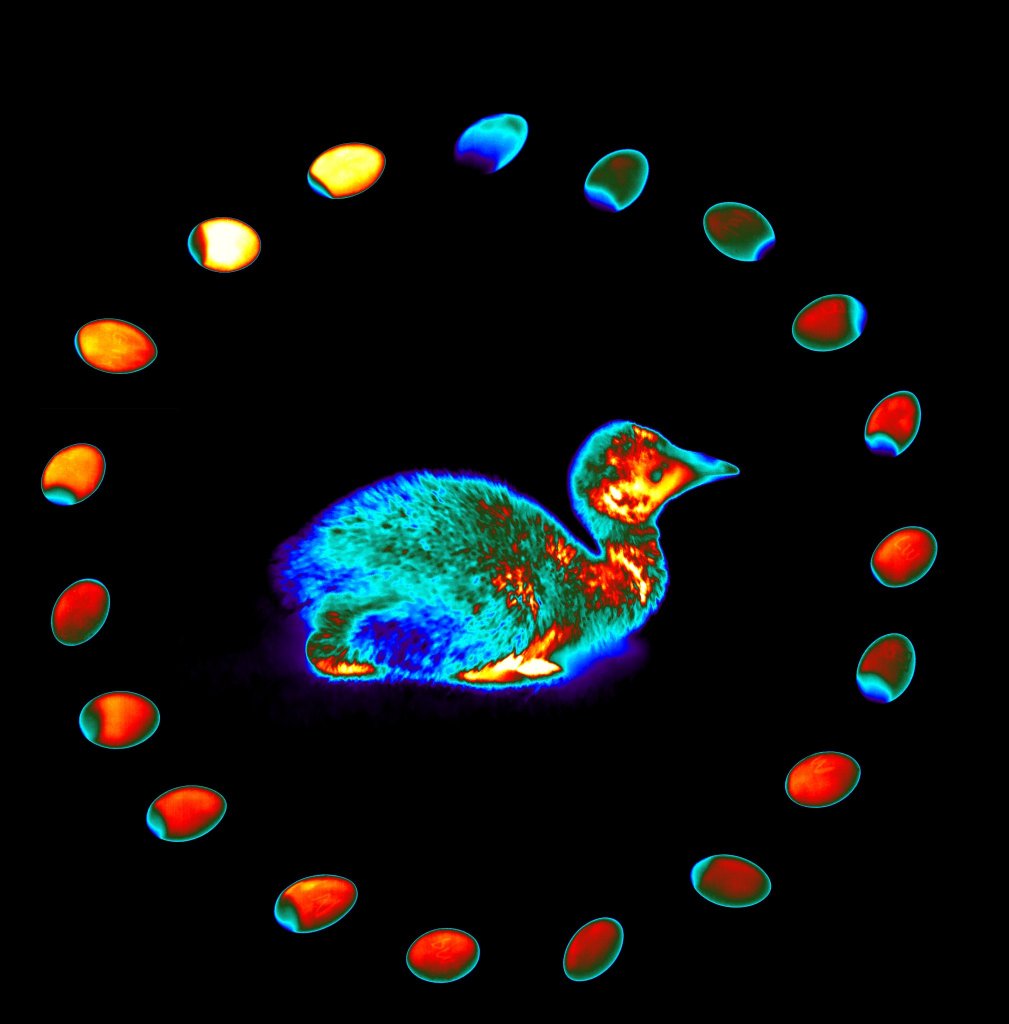
We also published some simple results on how the angle of incidence influences thermography measurements (see image above of the puffin). This is also well known by thermal imaging engineers and physicists, but not likely well appreciated by biologists, so we used a Leslie cube (see image below) and adhered various bits of biological materials to a copper surface, heated the surface up and painstakingly measured the temperature, allowing us to calculate the apparent emissivity. Objects at steep angles of incidence to the camera will have a lower emissivity, which means that the apparent radiation we measure is actually a lot of background reflected radiation, and thus is a source of possible error in field thermography.
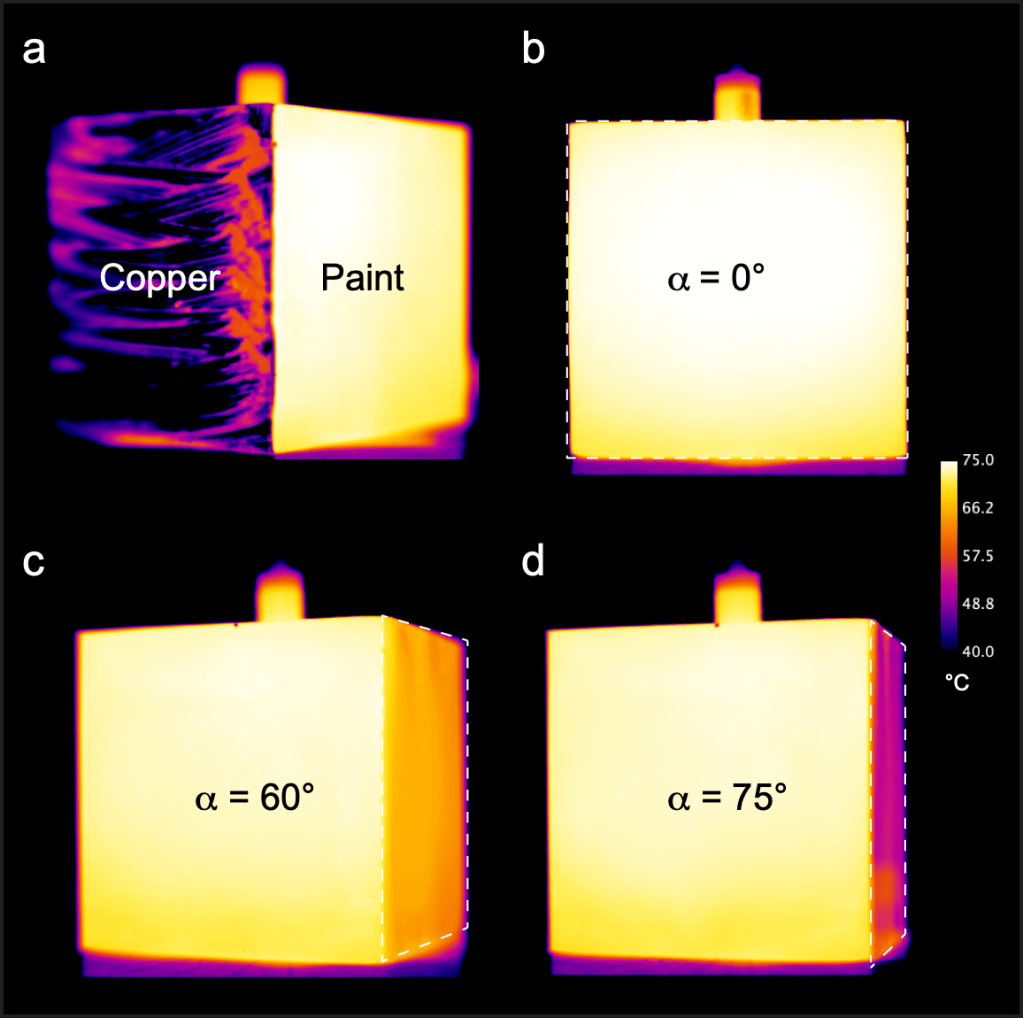
So the main message of the paper is to keep good records of how far your camera is from your object of study. Correcting for this effect is complex and beyond the scope of our study, although we report that the potential error of being 10 meters away from an object can be as high as 4 to 6C, with similar errors for measuring objects at angles greater than 50 degrees incidence.
Acknowledgements
Many thanks to Núria for her hard work on this project. Without her visit, we would not have done this. And we also want to thank the two reviewers for their hard but fair questions but also for listening to our response.
Lockdown science had me borrowing plant material from my parents, Clifford and Brenda Tattersall, so their help was crucial to the final acceptance of the manuscript!
Citation
Montmany-Playà, N. and Tattersall, GJ. 2021. Spot size, distance, and emissivity errors in field applications of infrared thermography. Methods in Ecology and Evolution. https://doi.org/10.1111/2041-210X.13563
References
Faye, E., Dangles, O. & Pincebourde, S. (2016) Distance makes the difference in thermography for ecological studies. Journal of Thermal Biology, 56, 1-9.