Although not an inspiring or catchy title, our study has just been published, demonstrating that fixed-frame video capture can provide a quantitative assessment of energetics (citation below).
Summary of the study
Infrared thermal imaging is a passive imaging technique that captures the emitted radiation from an object to estimate surface temperature, often for inference of heat transfer.
Infrared thermal imaging offers the potential to detect movement without the challenges of glare, shadows, or changes in lighting associated with visual digital imaging or active infrared imaging.
In this paper, we employ a frame subtraction algorithm for extracting the pixel-by-pixel relative change in signal from a fixed focus video file, tailored for use with thermal imaging videos.
By then cumulatively summing the sd for each frame across an entire video, we are able to assign quantitative activity assessments to thermal imaging data for comparison with simultaneous recordings of metabolic rates. We tested the accuracy and limits of this approach by analyzing movement of a metronome (see above) and provide an example of the approach to a study of Darwin’s finches.
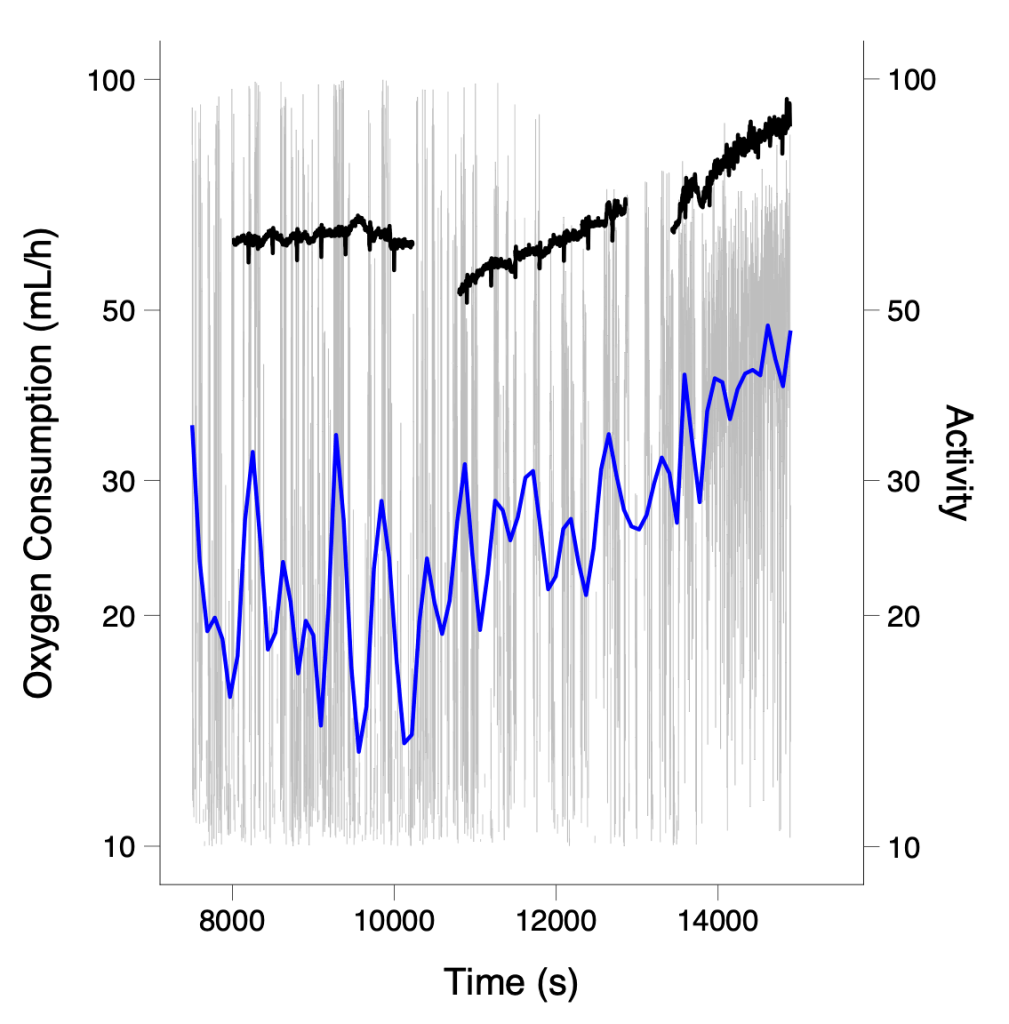
Simultaneous measurements of oxygen consumption (dark black lines) match up well with smoothed estimates (blue lines) of the activity score (grey lines) derived from the difference image thermography videos. Resolving fast respirometry data is difficult and best left to the experts at Sable Systems, but the average trends are informative for energy expenditure.
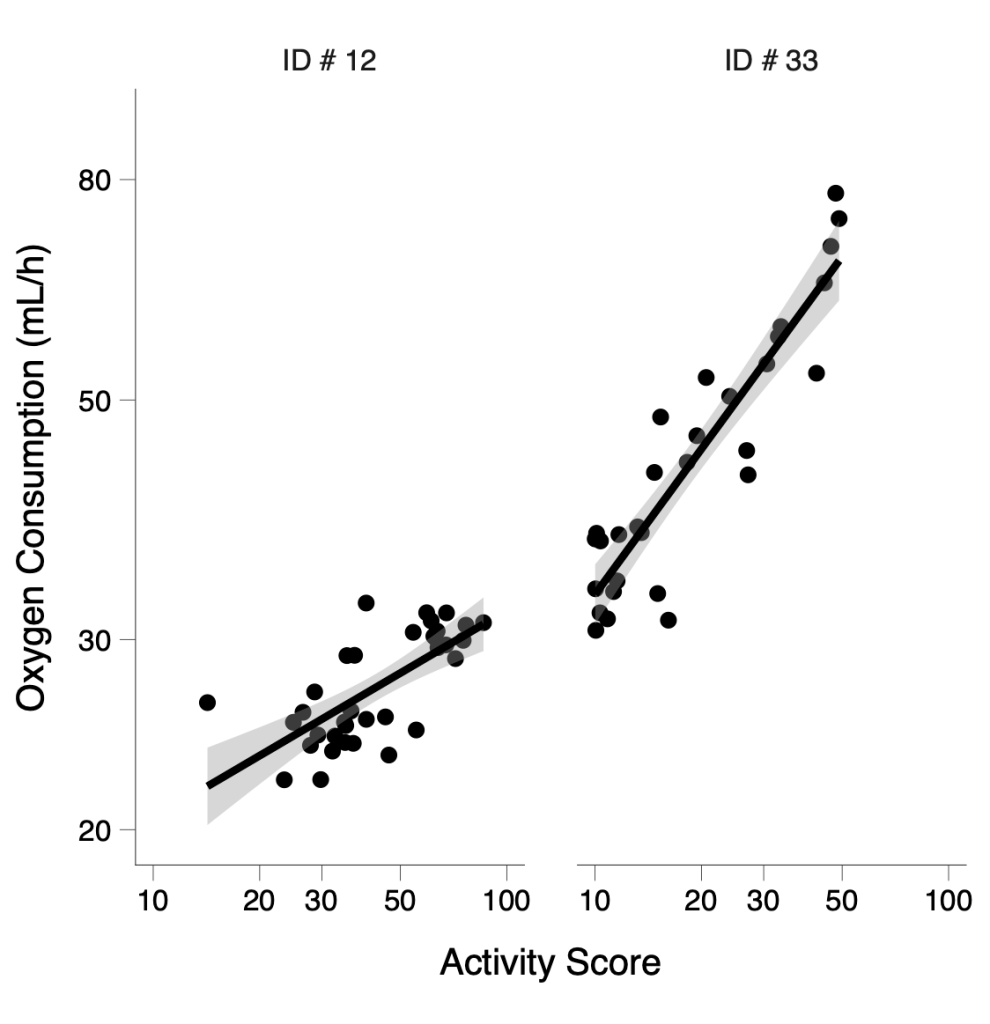
In principle, this “Difference Imaging Thermography” (DIT) would allow for activity data to be standardized to energetic measurements and could be applied to any radiometric imaging system.
Caveats
Fixed frame is required. Changing the reference frame or using a camera without a tripod would not work unless you do a lot of motion correction. Also, we used infrared thermal imaging because we were collecting data for a different purpose (still writing those up!), but we think that any sort of imaging should work, provided it produces a simple, ratiometric or radiometric image. Usually monochrome cameras or near infrared cameras produce a signal that is a simple greyscale image. Reflected light might interfere with the approach, so this is why we argued this might be an addition use of thermal imaging videos.
Behind the scenes
This paper took a long time to put together, but was the beginning of my lab’s journey into R, ImageJ, and open source coding. A lot has changed since I started the data analysis. Combing through 500 Gb of video files, extracting, processing, converting them into something manageable took the better part of 2 weeks on a supercomputer, until I realised that there were more efficient routes!
We have since created routines in ImageJ that help facilitate the conversions and have placed those routines in a github repository, where we will write them up as a methods paper in the future. The principles outlined in the paper are not themselves novel. Sliding average and frame subtraction routines are common in video processing software. Assessing whether the motion captured is correlated with meaningful biological information is what we hoped to capture with the study.
Citation
Tattersall, GJ, Danner, RM, Chaves, JA, and Levesque, DL. 2020. Activity analysis of thermal imaging videos using a difference imaging approach. Journal of Thermal Biology. 91 102611 https://doi.org/10.1016/j.jtherbio.2020.102611
Link to the full text here (first 50 clicks can access the paper).
