The following is a guest blog by Dr. Joshua Robertson Tabh
In my short research career, I’ve come to accept (even relish) that there are some projects that endlessly surprise; projects with shifting objectives that find you running drive-by thermal camera hand-offs along the QEW at questionable hours. The project that I’m about to describe is one of “those”. And curiously, despite the innumerable twists and turns, it just so happened to be a project with some of the most useful outcomes I’ve helped to produce. In this guest post, I’ll describe those outcomes.
But first, let’s begin in 2016. I had just begun my PhD research in avian stress physiology, and mere months before, Paul Jerem and others had released a highly intriguing protocol which suggested that the physiological stress response could be detected, and possibly quantified, in birds by simply measuring changes in body surface temperature (https://www.jove.com/t/53184/thermal-imaging-to-study-stress-non-invasively-in-unrestrained-birds). The rationale behind their protocol was that following exposure to a stressor, the sympathetic nervous system triggers vasocontriction of blood vessels at the skin (among other things), which manifests as measurable changes in skin temperature. This idea isn’t new. Rather, it likely dates back to the early 20th century or previous (e.g. Wolff and Mittelman, 1937). However, Jerem et al’s protocol was the first to show that a stress-induced change in skin temperature could be detected at the eye region in a wild bird, using infrared thermography (see Edgar et al, 2013, for a study in chickens). A clever application of thermography.
Jerem et al’s work was exciting. But a few important questions seemed to linger:
(1) how well does this stress-induced change in eye region temperature reflect circulating changes in sympathetic nervous system markers (i.e. catecholamines, like adrenaline and noradrenaline)?
(2) Are changes in surface temperature at other bodily regions better indicators of the physiological stress response than the eye region (e.g. the bill: https://journals.biologists.com/jeb/article/223/8/jeb220046/223869/Body-surface-temperature-responses-to-food)?
And (3) how robust and reliably detectable are stress-induced changes in body surface temperature? More specifically, how resilient is this response to masking by changes in bird position (see: https://besjournals.onlinelibrary.wiley.com/doi/abs/10.1111/2041-210X.13563)?
So, being nagged by these questions, a team of ecophysiologists (Glenn Tattersall, Gary Burness, and Oliver Wearing), an endocrinologist (Gaby Mastromonaco), and myself sought answers.
To do so, we required an experimental approach that would allow us to measure both body surface temperature (here, at the eye region and bill) and circulating catecholamines in “stressed” and “unstressed” birds. However, measuring circulating catecholamines requires sampling blood. And since puncturing a vein with a syringe is surely sufficient to activate a physiological stress response on its own (thus rendering “unstressed” birds “stressed”) blood sampling by this standard method simply wasn’t possible. Ideally, we would fit a sample of birds with central venous catheters to permit blood sampling without capture and venipuncture. This approach could work, however, even if blood samples were to be collected effectively, catecholamines can be a pain to quantify, even for contracted labs with high-end machinery. It’s for this latter reason that we accepted the reality of leaving our first research question unanswered.
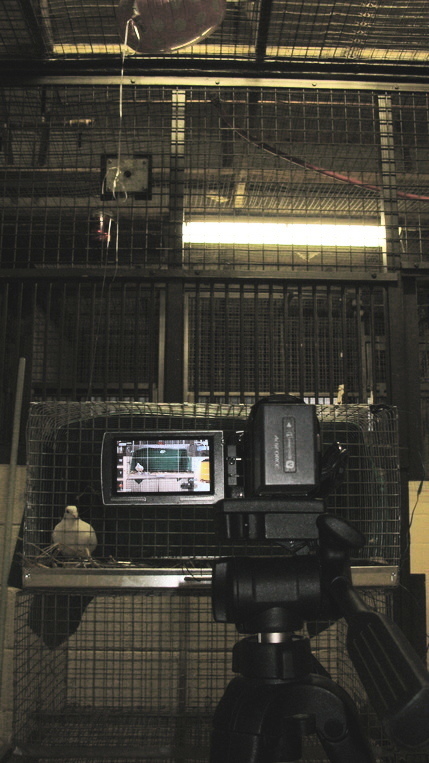
Nevertheless, we could persist with a simple experimental design to answer research questions (2) and (3); quite simply, thermographically image birds during rest (Fig 1) and during a stress exposure (for us, handling). To answer question (2), we would then quantify and compare the magnitude of stress-induced changes at the eye region and bill. And lastly, to answer question (3), we would aim to test the effect of head angle on our ability to detect stress-induced changes in eye region and bill temperature. In theory, a nice and clean approach.
Before I get to the answers of our remaining research questions, a small note on how we estimated head angle (for the interested reader).
Estimating Head Angle from 2D Image
Estimating the orientation of a 3D object from a 2D angle has been a concern for humans since photography was invented. Among mathematicians, this challenge has since acquired a formal name: the “perspective-n-point” (or “PnP”) problem. All solutions to the PnP problem first require knowledge of where, in a 2D plane, at least 3 points in an imaged object lay. We’ll call these points “landmarks”. Of course, more than 3 landmarks are best to improve estimation accuracy, but most agree that 3 will do for a reasonable guess. Next, rough dimensions of the imaged object in 3D space are needed. Such dimensions must be sufficient for one to estimate where the chosen landmarks may lie, relative to each other, in a theoretical 3D co-ordinate system known as the “world co-ordinate system”.
Once this information is collected, several geometrical approaches may be used to calculate how the imaged object must have moved or rotated such that the landmarks in 3D space overlap with those observed in 2D space (after adjusted for lens distortion). Interestingly, there is one industry with considerable investment in creating efficient geometrical approaches: virtual reality (or “VR”) gaming. Why? Because using VR gaming requires that the system can estimate the gamer’s 3D position at all times (with, interestingly, tiny infra-red lights implanted in the headset as landmarks). Thanks to this investment by the VR industry, studies developing and comparing the accuracy of geometrical solutions to the PnP problem are flourishing. It’s a perfect time for biologists like us to start taking a peak at them.
For our study, we chose to use to an approach called the “EPnP” that was first proposed by Lepetit and others in 2009 (https://link.springer.com/content/pdf/10.1007/s11263-008-0152-6.pdf). We chose this approach because it permits one to use >4 landmarks for positional estimation (thus reducing error) with little cost to computational time relative to traditional solutions. Other approaches have been lauded for improving accuracy (e.g. P3P with RANSAC) and we encourage others to pursue those approaches. For our study, however, we were interested in balancing accuracy and efficiency.
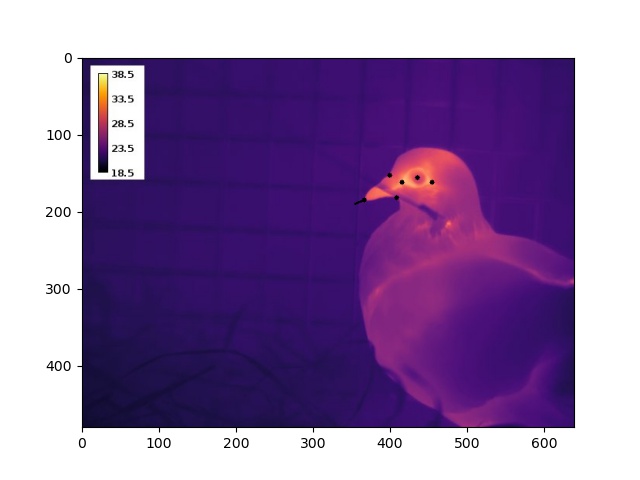
To execute the EPnP approach, we estimated the 2D position of up to 9 landmarks on a pigeon’s head by loading our thermographic images into ImageJ (Fig 2). Building a 3D model turned out to be much less time consuming – simply draw on morphometric measurements of domestic pigeons reported in literature. From these data, and EPnP algorthims, we were thus able to estimate both a 3D translation and 3D rotation of an imaged bird’s head, relative to a virtual model of a perpendicularly facing individual.
Our results?
I’ll break them down by question.
Question (1): How well does this stress-induced change in eye region temperature reflect circulating changes in sympathetic nervous system markers (i.e. catecholamines, like adrenaline and noradrenaline)?
Answer: Yet unanswered.
Question (2): Are changes in surface temperature at other bodily regions better indicators of the physiological stress response than the eye region (i.e. the bill: https://journals.biologists.com/jeb/article/223/8/jeb220046/223869/Body-surface-temperature-responses-to-food)?
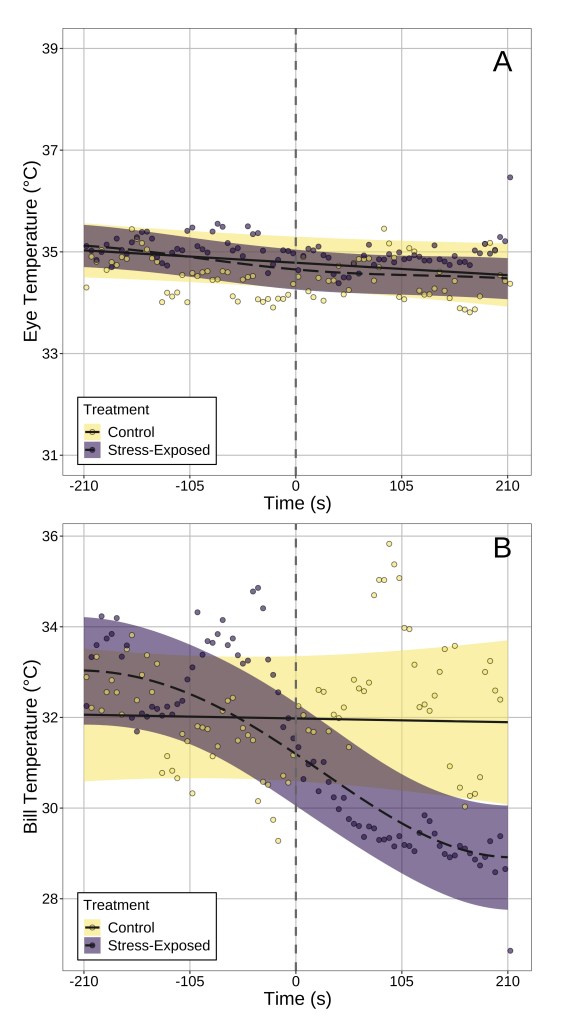
Answer: Our results suggest that, at least in our study species, surface temperature the bill is probably a better indicator of stress physiological state. I’ll explain why by referencing what we observed from data that did not control for head position. After stress exposure, bill temperature fell significantly by ~4°C after stress exposure (handling), while eye region temperature did not significantly change (Fig 3). Rather, temporal patterns in eye region temperature appeared remarkably similar between “stressed” and “unstressed” birds. Moreover, only stress-induced changes in bill temperature showed significant inter-individual variation, suggesting that if one wishes to build a metric of “stress-responsiveness” from changes in surface temperature, doing so at the bill is likely more effective than at the eye region.
Question (3): How robust and reliably detectable are stress-induced changes in body surface temperature?
Answer: It depends on where you look. After correcting for changes in head position in our birds, a significant effect of stress-exposure on eye region temperature emerged (Fig 4). This was not the case for stress-induced changes in bill temperature, which were detectable regardless of whether head position was accounted for or not. This point, we think, is particularly important for two reasons:
(1) don’t correct for changes in object position and you risk missing out on detecting biological processes, and
(2) surface temperatures of some body regions might be better indicators of your biological process of interest than others.

Take Home Message
To conclude, drawing biological inference from thermographic images is tricky. Many sources of error can get in the way of your ability to meaningfully do so, and a common one is changes in object position. As such, biologist should always remember to correct for object position when working with their surface temperature data – perhaps by using our method or another.
Read the full study here: https://physoc.onlinelibrary.wiley.com/doi/10.14814/phy2.14865.
Citation
Tabh, Joshua KR, Burness, G, Wearing, OH, Tattersall, GJ, Mastromonaco, GF. 2021. Infra-red thermography as a technique to measure physiological stress in birds: body region and image angle matter. Physiological Reports, Accepted. https://doi.org/10.14814/phy2.14865
Acknowledgements
Dr. Joshua Robertson Tabh is a graduate of Trent University, co-supervised by Dr. Gary Burness and Dr. Gaby Mastromonaco. This research was made possible with the cooperation of the Toronto Zoo and by the watchful eye of Oliver Wearing. Since 2016, Joshua and Glenn have shared many conversations about avian physiology, imaging, and coding and Glenn invited Joshua to guest author this post after all these efforts finally reached the publication stage.
Funding for this research was provided by the Toronto Zoo Foundation, an NSERC Collaborative Research and Training Experience Program (Grant #: CREATE 481954-2016), a Howard P. Whidden grant to OHW, and an NSERC Discovery Grant to GJT (Grant # RGPIN-2014-05814).
