A new study led by Morgane Vandendoren, Nicole Bedford, and others from Adam Nelson’s lab at the University of Wyoming has uncovered a new role for oxytocin, the so-called “love hormone.” Published in eLife, the research shows that oxytocin neurons in the paraventricular hypothalamus act as a kind of biological switch, helping mammals transition from cooler, resting states to warmer, active ones. Using mice, the team combined calcium imaging, optogenetics, and behavioural observation to show that bursts of oxytocin neuron activity reliably occur just before an animal warms up and becomes active, even in the absence of social cues. These neurons appear to coordinate both thermogenic (heat-producing) and behavioral arousal, revealing a new layer of oxytocin’s influence that bridges physiology and behaviour.
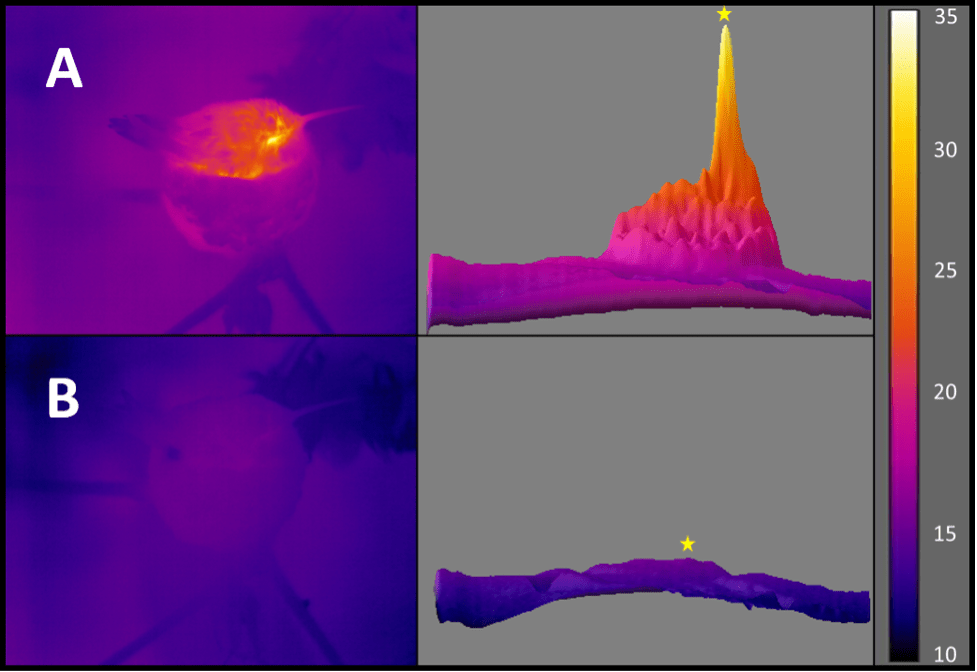
This collaboration, with contributions from several Wyoming students and collaborators, demonstrates how oxytocin not only shapes social and maternal behaviours but also tunes the body’s thermal and arousal cycles. My lab’s involvement was a bit on the periphery, but focused on the thermal imaging and coding pipelines that helped visualize these rapid transitions in body temperature and activity. Together, the findings expand our understanding of oxytocin beyond its traditional social context, showing that it also plays a key role in the daily rhythm of energy balance and physiological readiness.
The University of Wyoming have a more detailed press release for the study here:
This paper was published in eLife, following an open peer review approach that I am still trying to wrap my head around. The citation is below, and so formally the study is published in preprint format, with us having still to upload a revised manuscript which will address some of the points raised by the reviewers.
Citation
Vandendoren, M, Rogers, JF, Landen, JG, Killmer, S, Alimiri, B, Pohlman, C, Tattersall, GJ, Bedford, NL, Nelson, AC. 2025. Oxytocin neurons signal state-dependent transitions to thermogenesis and behavioral arousal in social and non-social settings. eLife, 14: RP108212. https://doi.org/10.7554/eLife.108212.1