Hornbills and Toucans and Beaks…

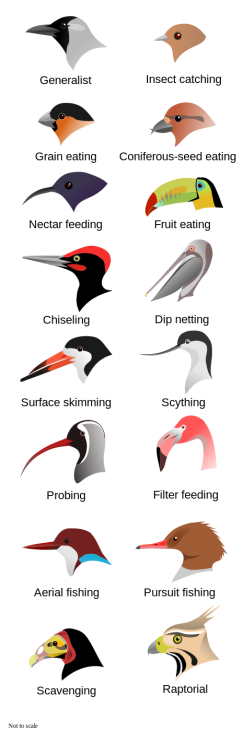
Avian bills are fascinating structures, having evolved a 465px-birdbeaksa-svgmyriad of forms and functions, as depicted in the montage on the right from: https://en.wikipedia.org/wiki/Beak
Today a new publication on this subject has been published in PLoS One, highlighting the multi-tasking capacity of form and function.  You can find it here and blogged about here.

The authors make the major point that hornbills use their bills like toucans do (as radiators of body heat, showing evidence of greater relative blood flow recruitment at warmer temperatures), but that their calculations suggest that the per area rate of heat exchange in the hornbills is less than the toucans.

This is a nice addition to the recent work done by a number of us in the field (see references below, e.g. Symonds and Tattersall, 2010), emphasizing that bills are not the dead, static structures that many assume they are.

One main point the authors note (they base their comparison mainly vs. toucans from our 2009 paper) is that the bills of hornbills are not as effective as dissipators of heat compared to the toucan and quite likely for multiple reasons: 1) the hornbills’ bill is thicker, so is a heavier barrier to heat exchange, likely because the hornbills use their bills as digging implements and must be more robust, and 2) toucans “switch on” their blood flow at lower temperatures than hornbills, and the lower the air temperature, the greater the driving force for heat loss, and 3) the hornbill bill is relatively smaller than the toucans.  The reason for the hornbill vs. toucan comparison is because the two lineages have long been viewed as old world vs. new world convergences (although that is really an oversimplification).

One point I’d like to emphasize that is often missed in the popular press.  These large billed birds are not unique in their bills’ thermal radiator function, since many other birds exhibit similar capacities to modify blood flow to their bills (geese, ducks, sparrows to name a few).  They are, however, striking in how large their bills are, which is why they garner such attention.

Here is a photograph of a hornbill (what mother could not love that face?):

Glenn_pic 2.jpg

Photo: Courtesy Dr. Andrew McKechnie


Hornbill.jpg

Figure from van de Ven (2016), showing the obvious blood vessels under the surface of the bill.

Some technobabble about how the measurements are made:

Like myself, these researchers used thermal imaging to obtain their results (see their paper for images and thermal videos), which means that heat exchange is an estimation of events and is done under sampling assumptions.  I’ve been working on calculations to make things easier for myself and colleagues (see below for R package), and came across a couple of things.  Firstly, some of the assumptions van de Ven et al (2016) used are different than the ones we made (Tattersall et al 2009).  We assumed higher wind speeds (5 m/s) in our modelling, which I think are a little on the high side of reality.  van de Ven et al (2016) on the other hand, assumed a wind speed of zero and therefore incorporated only free convection estimates.  Gates (2003 – Biophysical Ecology) advises that forced convection is the more realistic scenario for heat exchange in animals since wind speeds are rarely exactly zero, and suggests values between 0.5 and 1 m/s.  This means that van de Ven’s estimates of convective heat will be underestimates, while our toucan data are over-estimates.   Anyhow, the good news is that van de Den realized this when making comparisons to our previous work and made comparisons using free convective heat exchange (while politely not criticizing us for our over-zealous wind speeds).  The take home message though is that their published values for both species are on the low side, while our published values are more for what a flying bird might experience.

For anyone interested in using their thermal images for similar analyses, I have create a package in R called “Thermimage” to help in the calculations.

See https://cran.r-project.org/web/packages/Thermimage/index.html for the package itself and https://github.com/gtatters/Thermimage/blob/master/heatcalc.R for some sample scripts.

References

Gates, DM 2003. Biophysical Ecology.  Dover Publications, Mineola, NY, 611 pp.

Symonds M.R.E., Tattersall G.J. 2010 Geographical variation in bill size across bird species provides evidence for Allen’s rule. American Naturalist 176, 188-197. (doi:10.1086/653666).

Tattersall G.J., Andrade D.V., Abe A.S. 2009 Heat exchange from the toucan bill reveals a controllable vascular thermal radiator. Science 325, 468-470. (doi:10.1126/science.1175553).

van de Ven T.M.F.N., Martin R.O., Vink T.J.F., McKechnie A.E., Cunningham S.J. 2016 Regulation of Heat Exchange across the Hornbill Beak: Functional Similarities with Toucans? Plos One 11, e0154768. (doi:10.1371/journal.pone.0154768).

Additional sources

Greenberg R., Danner R.M. 2012 The Influence of the California marine layer on bill size in a generalist songbird. Evolution 66, 3825-3835. (doi:Doi 10.1111/J.1558-5646.2012.01726.X).

Greenberg R., Danner R., Olsen B., Luther D. 2012 High summer temperature explains bill size variation in salt marsh sparrows. Ecography 35, 146-152. (doi:Doi 10.1111/J.1600-0587.2011.07002.X).

Greenberg R., Cadena V., Danner R.M., Tattersall G.J. 2012 Heat loss may explain bill size differences between birds occupying different habitats. Plos One 7. (doi:ARTN e40933 DOI 10.1371/journal.pone.0040933).

Hughes A.L. 2014 Evolution of bill size in relation to body size in toucans and hornbills (Aves: Piciformes and Bucerotiformes). Zoologia-Curitiba 31, 256-263.

McNab B.K. 2001 Energetics of toucans, a barbet, and a hornbill: Implications for avian frugivory. Auk 118, 916-933.

Seki Y., Bodde S.G., Meyers M.A. 2010 Toucan and hornbill beaks: A comparative study. Acta Biomater 6, 331-343.
Thermimage for R on CRAN

Rplot

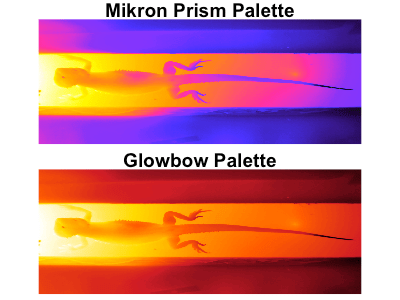
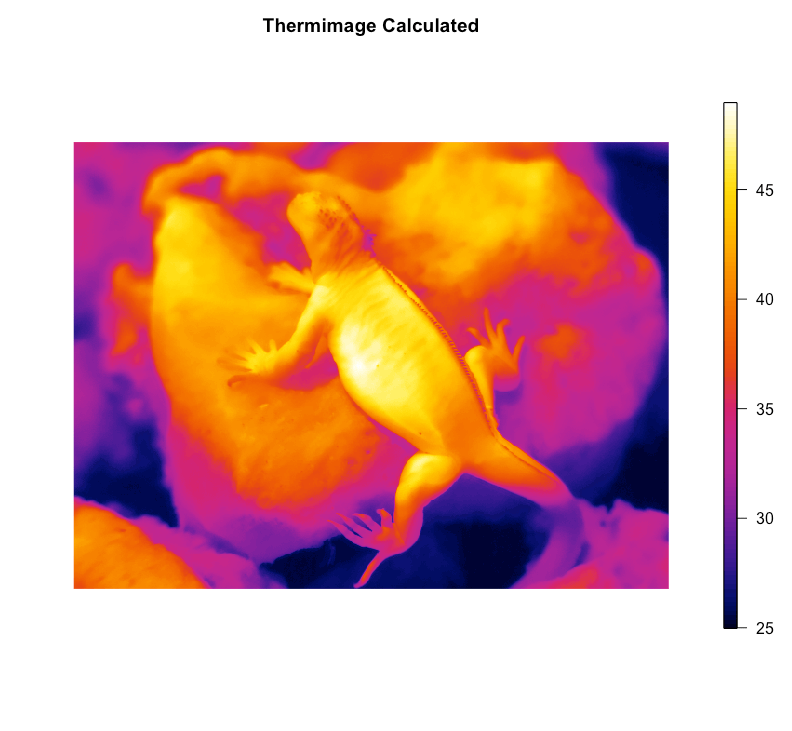
I’ve updated the Thermimage package.  The recent update includes calculations for modelling heat transfer from radiative and convective heat transfer from the animal to the environment, using temperatures captured from infrared thermal images.

The assumption is that the user already has temperature information captured and is simply using R to to analyse temperatures.  I am working on scripts for importing FLIR images into R but these are not yet included in Thermimage, since these scripts rely on external applications (EXIFTOOL) that have implementation issues in R.  (Edit: July 20, 2016, v 2.2.0 has a function for importing FLIR thermal jpgs for processing in R)

Thermimage is on Cran now at the following url:

https://cran.r-project.org/web/packages/Thermimage/index.html

Sample scripts on how to put the heat transfer equations to use are at:

https://github.com/gtatters/Thermimage/blob/master/heatcalc.R

I’ve also included a script to “test” the validity of the thermal image calculations where I convert the binary thermal image data into temperature:

https://github.com/gtatters/ThermimageCalibration/blob/master/ThermimageCheckCalculations.R

MarineIguana.png

Any issues with the code can be raised here:

https://github.com/gtatters/Thermimage/issues

Conference Season

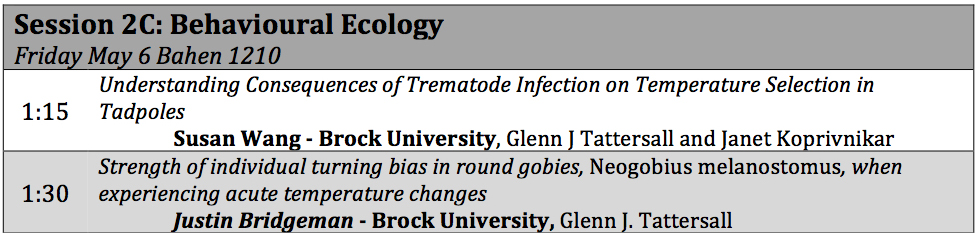
It’s been a busy two weeks in the lab, courtesy of my hard working graduate students.  Susan, Justin and Anne presented their thesis research at the Ontario Ecology and Ethology Colloquium last week.  Here are some screen shots of their abstract titles.

oe3c-2016-final-program_may2oe3c-2016-final-program_may3

Then, this past week, the lab attended the Canadian Society of Zoologists conference to present our research.  Justin and Susan represented the lab work at Brock, while Cayleih Robertson (PhD student of Grant McClelland at McMaster) presented her work (a collaboration I’m happy to be part of).  Everyone gave excellent talks and appeared to enjoy the conference and workshops.

Susan Wang received an honourable mention for the CAS Lindsay Prize for best oral presentation in the Parasitism, Immunity, and Environment section. We’re all very proud of her!

JustinSusanCayleih

Finally, although Dimitri Skandalis left the lab a number of years ago, I was very pleased that Dimitri received the William S Hoar Award for best overall student presentation at the CSZ this year.    Here is is looking especially happy, as are his past and current supervisors (Left to Right: Darveau, Skandalis, Tattersall, Altschuler).

Dimitri and Supervisors.png

Thesis Defence a Success!

Congratulations to Ian Black for successfully defending his MSc thesis from research in my lab.   Ian’s thesis was entitled “Orientation Preference and Behavioural Thermoregulatory Coordination in Pogona vitticeps”.


Many thanks to Dr. Jacqueline Litzgus (Laurentian University) for being his external examiner and giving a fair and comprehensive assessment of his work.  Also thanks to Dr. Joffre Mercier, Dr. Robert Carlone and Dr. Alan Castle, committee members and defence committee for their gruelling questions.

I want to take this chance to thank Ian for being a member of the lab and for making it to this stage.  You will always be part of the lab and I wish you all the best in the future.  Enjoy the freedom of reaching a milestone.

Thermal Camera Showdown – FLIR ONE vs. FLIR SC660

Last summer, I had a high school volunteer (Padraic Odesse) join my lab for a few hours a week to help out my graduate students with data analysis.  To assist him with learning about imaging, technology, and experimental design, I set up a simple experiment for him to test.  Since I am often asked by people whether the new consumer oriented thermal imaging products are ‘up to snuff’ or useful as research devices, I gave my lab assistant the task of capturing images with a high end thermal camera (FLIR model SC660, which has 640×480 image resolution and thermal resolution ~0.03C) and with the $300 dollar iPhone attachment (FLIR ONE, image resolution 80×60, enhanced up to 160×120, not sure its technical specs on temperature detection).

Here is what the FLIR ONE looks like, nestled next to my lab standard for temperature measurement (accuracy ~0.2C), a thermocouple meter from Sable Systems International.

The camera is a nifty attachment to my iPhone 5, although I look like I’m carrying a bulky phone around with me.  The attachment is actually two cameras in one.  The one lens is the lens that allows long wavelength infrared radiation to pass through to the detector and the other lens is probably very similar to an iPhone camera.  Because they are adjacent to each other, they very nearly capture a similar field of view.  The FLIR software lets you do neat things with overlaying the images, but to be honest, I find the whole outline overlay to be annoying.  Great fun for non-professionals, but annoying if you wanted to use this camera for scientific purposes.

The FLIR ONE has a little pull down switch that turns the device on, but also acts as a shutter control.  I’m not 100% certain what FLIR does, but given how their other cameras work, what is likely is that the when the shutter is pulled down, the thermal sensor is receiving a constant signal that it uses to “calibrate” itself.  FLIR calls this “tuning”, not “calibrate” and I am putting things in quotes since I don’t quite know.  What other thermal imagers tend to do is use a shutter like this as a reference signal, and also for Non-Uniformity Correction of the pixel array.  If the reference signal is at a known and constant temperature, you can, in essence, calibrate the thermal detector to a more stable source.  It’s clearly more complicated than that, but suffice to say, the FLIR ONE demands to be tuned on a regular basis!

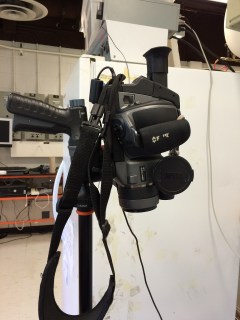
Here is the competition, my FLIR SC 660

Mounted on a tripod ~0.4 m away from our temperature source

The temperature source

Which is easy to confirm temperature with the thermocouple meter:

Since distilled water has a high and known emissivity, it makes it an easy target to produce thermal images from that will be consistent over time (plus/minus error and resolution of the controller).

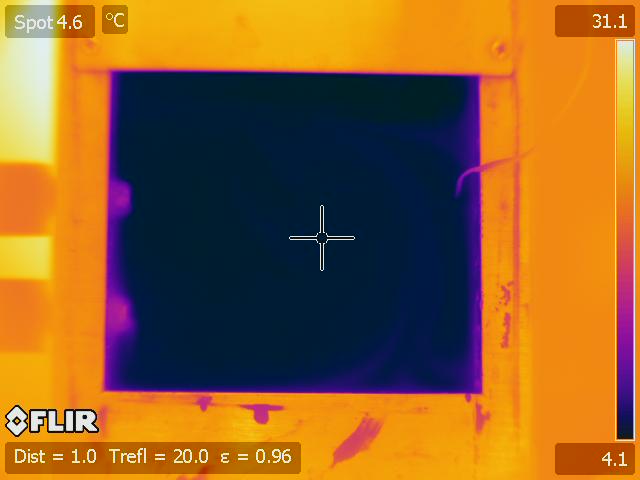
Here is a sample image taken with the FLIR SC 660:

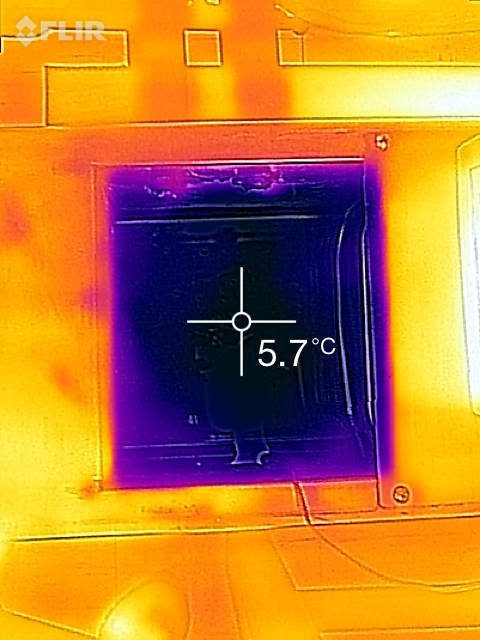
Here is a sample image taken with the consumer product, FLIR ONE:

As I describe elsewhere (I will post a link to a review paper that will be in press in a month or so), the FLIR ONE product saves its default image as a composite of a thermal image with a haloed/outline image in the usual FLIR JPG format.  So, if you have other FLIR software, you can extract the actual thermal image and do proper thermography on the image.  If you don’t have their software, then you are basically stuck with whatever the spot sensor tells you what the temperature is.  I would not trust the spot temperature measurements.  The software does not allow you to set the emissivity precisely or numerically, and distance and other parameters are not available.  Use the spot temperatures cautiously!

Error Analysis

So, my lab assistant diligently captured an image with the two cameras, taken at the same distance and at 8 different water temperatures (5 to 40C).  We now had two camera’s data capturing the same source under identical conditions, and so we analyzed the water temperatures using FLIR Thermacam Rearcher Pro, setting object distance to 0.4 m, emissivity to 0.98 (http://www.infrared-thermography.com/material-1.htm), and reflected and atmospheric temperatures to 20C (which was the room temperature.
So, here are the results:
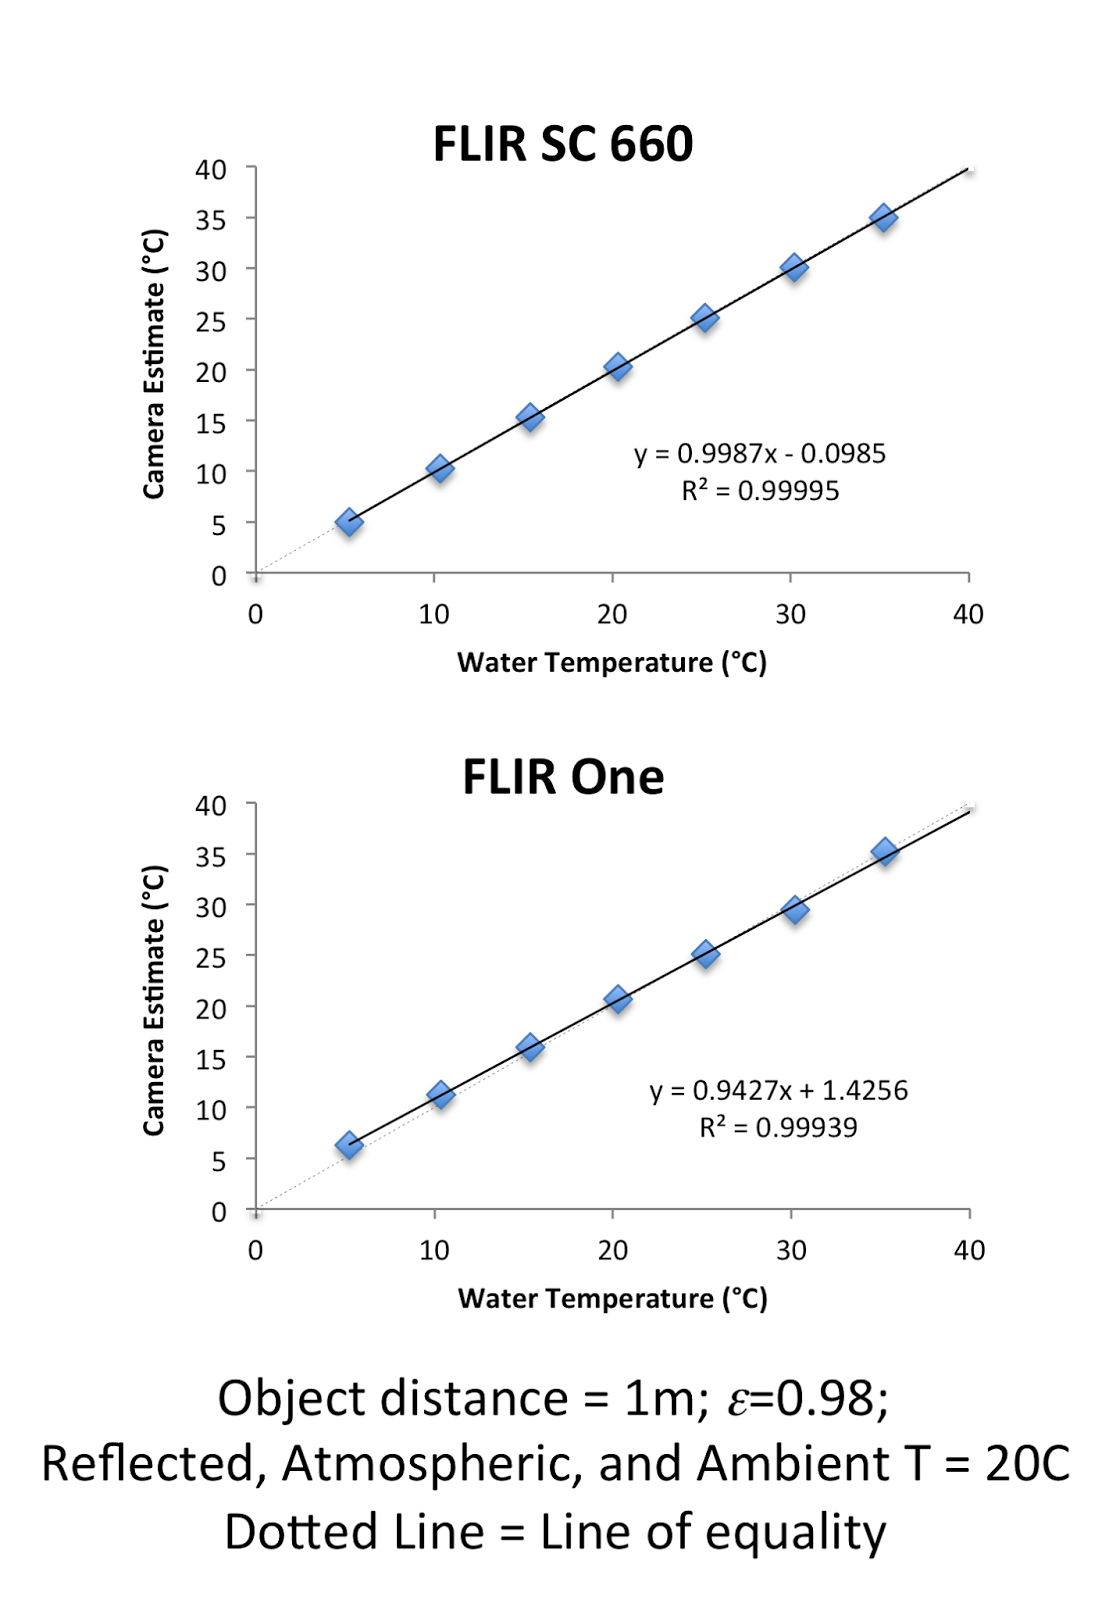
At a quick glance, they both perform quite well.  Look at those R2 values!  Rarely see that in biology. But these are engineered devices.  See how the FLIR ONE deviates in temperature at the low and high temperatures.  This tells me that there is some atmospheric contamination or attenuation of the signal the camera picks up.  The reason things look really accurate near room temperature is because the formula for calculating temperature predicts that if all temperatures are similar to each other, the contaminating radiation signal will be similar to the object signal.
If you narrow in on how large the error is this will make a bit more sense.  Take the difference in Camera – Actual temperature for all 8 measurements.  The mean absolute error will tell you whether the camera is reading higher or lower than actual temperature (absolute value simple removes the negative sign).   The standard deviation of those measurements is a metric for the resolution/sensitivity of the measurements.
Mean absolute error for the FLIR SC 660: 0.128°C
SD of the error for the FLIR SC 660: 0.0873°C
Mean error for the FLIR ONE: 0.603°C
SD of the error for the FLIR ONE: 0.41°C
On the whole, both cameras perform rather well under these optimized conditions, although clearly the SC 660 performs better.  An error of ~0.128°C is quite low, whereas the FLIR One error is ~5 times higher at 0.603°C.  This kind of error may be related to the electronics, warm-up time, or the sensitivity of the sensor itself, to name a few.
So, for measuring purposes, the FLIR ONE isn’t too bad.  Certainly not as inaccurate as I had feared it might be (except see below).  But, remember, we were performing the analysis using thermography software that allows for some correction of environmental variables, and we were constantly tuning the FLIR ONE.  Depending on your measurement purposes, you might be ok, but the best error you will get under optimal conditions appears to be greater 0.6°C.

Confounding Issues with the FLIR ONE

Because we ran the error analysis above under ideal conditions, we wanted to be a little more realistic with the FLIR ONE since it is likely to be used by scientists as an affordable alternative to work in the field.
The possible confounding issue I am referring to is the warm-up time and the camera’s physical temperature itself.  As is usual with cell phones, people are likely to keep the device in their pocket, or maybe leave it exposed to the elements.  If you then turn the thermal camera on and take a spot measurement, there is bound to be error associated with the lack of tuning, but also because the camera temperature is changing while you are making the measurements, which would confound the tuning process itself.
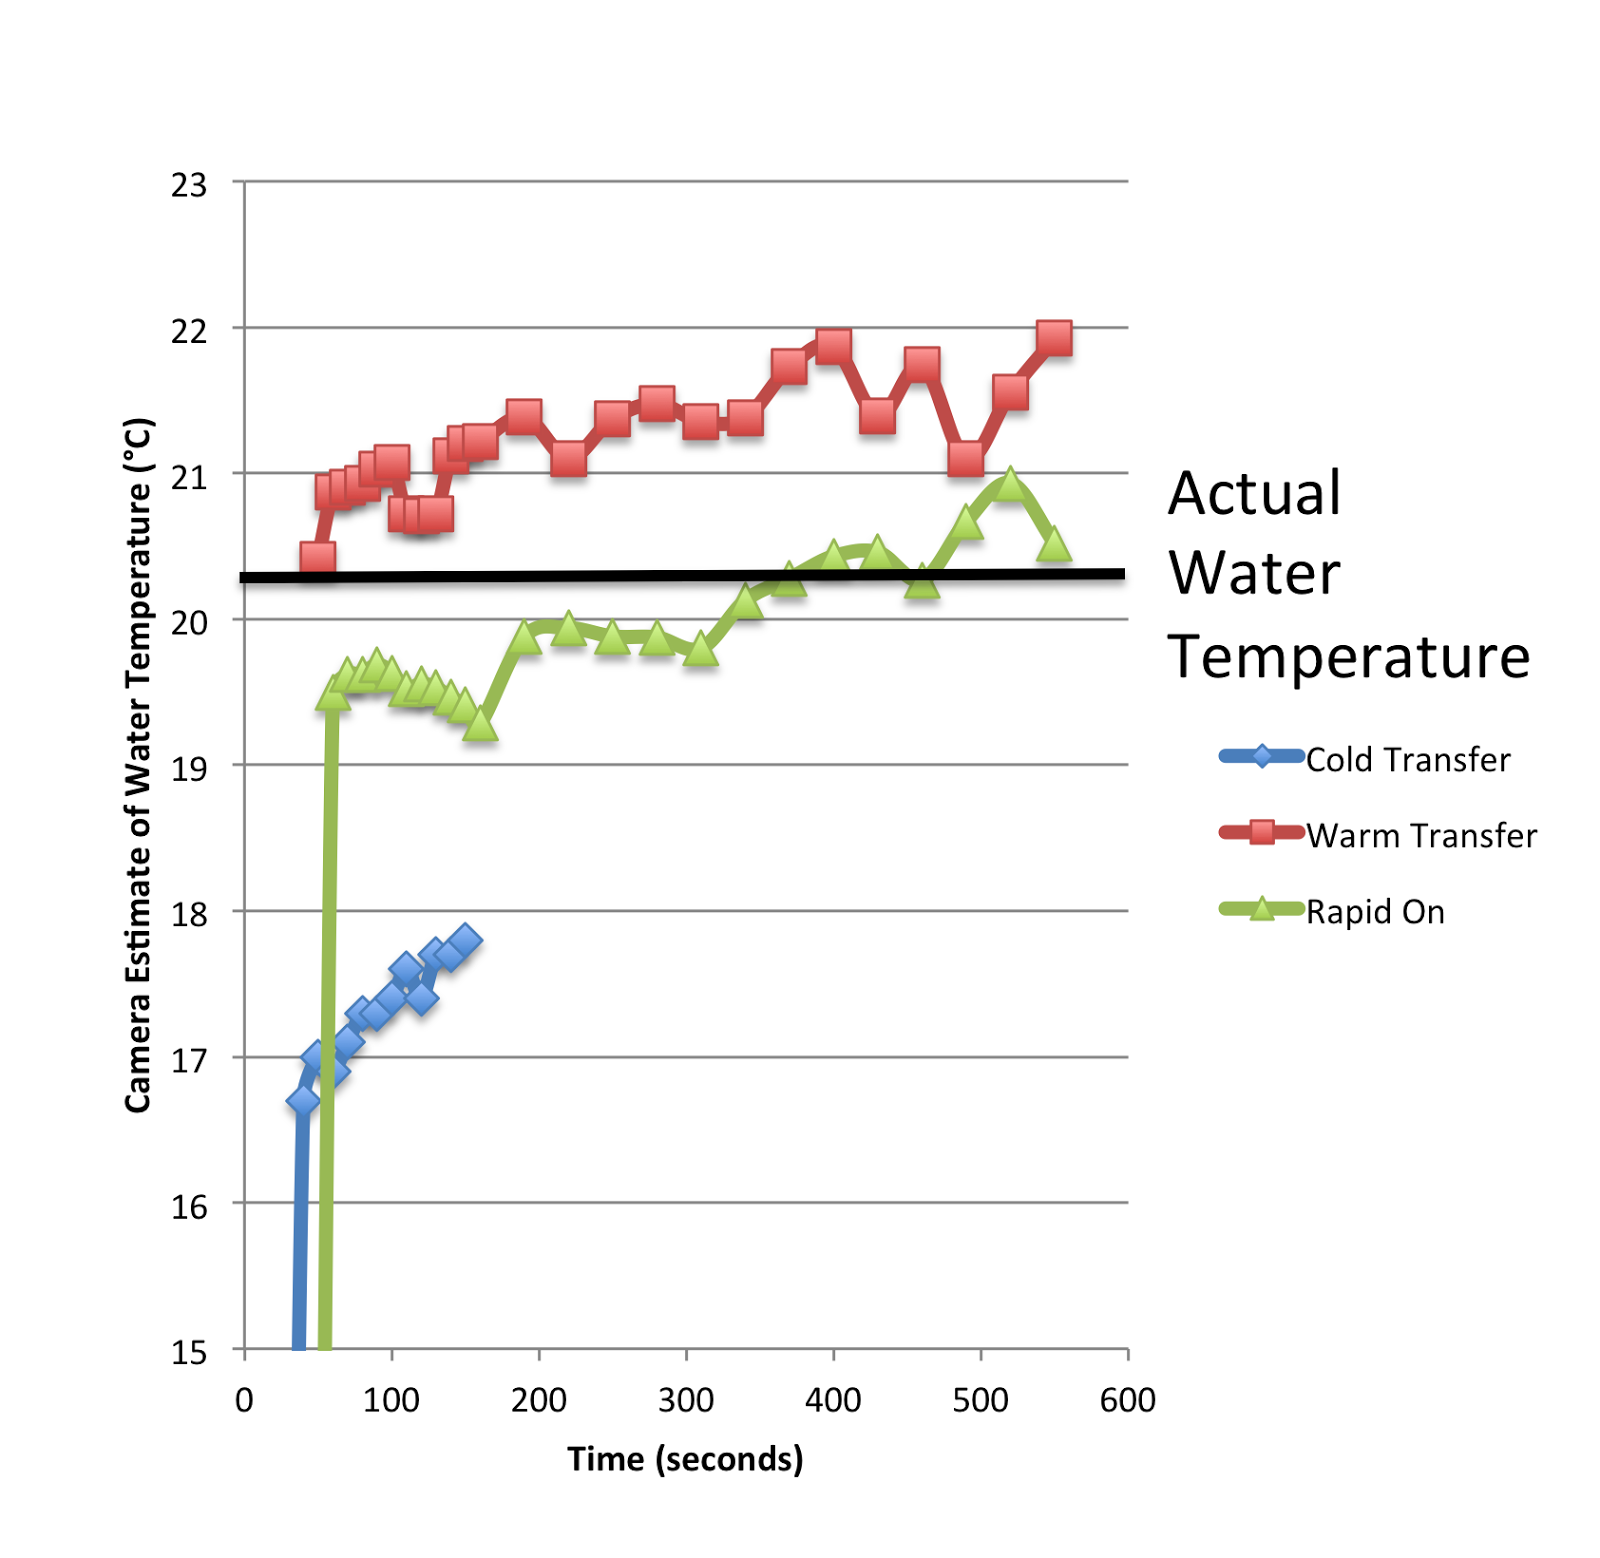
So we took as realistic an approach as possible ran the measurements 3 different ways. We stored the FLIR ONE in a cold room (5°C), a warm room (40°C) and at room temperature (20°C) for 30 minutes prior to use at room temperature.  Then, we turned the thermal camera on and rapidly started recording the spot temperature estimates every 10 seconds, tuning the camera whenever it demanded (there is a tilde ~ symbol that tells you when to tune).  Here are the resulting data (apparently we only ran the cold transfer for ~180 seconds, but the data are still obvious:
If you keep the camera in a cold room, it will severely underestimate temperature (by an average of 5.9°C!!).  It does not return to normal temperatures within 180 seconds.
If you keep the camera in a warm room, it will overestimate temperature (by an average of 1.0°C).  Strangely it does not seem to converge toward the real temperature within our 10 minute long experiment.  Note in the error analysis measurements before, the FLIR ONE did pretty well at measuring objects ~20°C, so this overestimate is due to persistent temperature effects on the device itself.
Finally, the rapid on data show you how the FLIR ONE really performs from rapid turn on (without a thermal equilibration problem), through various cycles of tuning.  Each time it jumps in temperature corresponds to when we tuned it.  It eventually converges toward the real temperature after ~8 minutes.
Its overall error is ~0.89°C during this warm-up period.
So, can you use the FLIR ONE for real science?  Lot’s of ifs and buts, and if you are prepared to calibrate it and check it, go for it (with the caveats above about a 5 times level of error).  I like mine for teaching purposes since it is portable and fast to use, but I will still use my SC 660 for most of my research purposes, due to the versatility of video capture functions, image resolution, and electronic stability.  If you choose to publish a scientific paper with a FLIR ONE, don’t ask me to be the reviewer.  I would insist on a calibration curve and assurance that these parameters have all been assessed.

Fine Print

I am not affiliated with FLIR, nor do I receive revenue, salary, or funding from them, so this post should not be interpreted as an endorsement.  Over the years,  I have sent them a lot of business from researchers who ask my advice on thermal imaging products, but I can safely claim that I have received no freebies, hand-outs, or in-kind contributions from FLIR.  Of course, I would be most grateful if FLIR did give me a free thermal camera or a news lens for all the fine press I give them!  If anyone from FLIR is reading this, please take note: you’re a big company and perhaps you might want to support basic research.

Why Scientific Discovery is Important & Why Science is Supposed to be Fun

It has been a while since I blogged, and I could go into details about a desire to ‘disconnect from the online world’ or give excuses that ‘there are too many things that occupy my time’, both of which are true…but that is for another time.

I wanted to post some reflections following the publication of a paper that represented contributions from a number of brilliant collaborators, particularly because we need a good news story in basic sciences.  I also wanted to reflect a little to give younger scientist reason to be positive about science.

Last week, we (collaborators from Brasil and Canada) published a basic discovery paper entitled: Seasonal reproductive endothermy in the tegu lizard” in Science Advances, the open access sister journal to Science, published by the AAAS.

The discovery has been well covered in the media already (see links here), and I will not go into too many details here, since it is all openly available at the link above, except to say that we discovered an animal that is usually considered to be ectothermic (“cold-blooded” is the horribly inaccurate term used by non-scientists) can become endothermic (“warm-blooded” – another equally uninformative and antiquated term to describe a complex array of metabolic changes), and it does so during the reproductive season.  As careful scientists, we did not comment in the study on their reproductive activities or indeed we had no measurements of what they were doing, so the link to reproduction is indirect at the moment.  The study was simply an observation that they become warmer during this time of the year and that the degree to which they warm up cannot only be explained by the usual suspects (e.g. behavioural thermoregulation, thermal inertia).

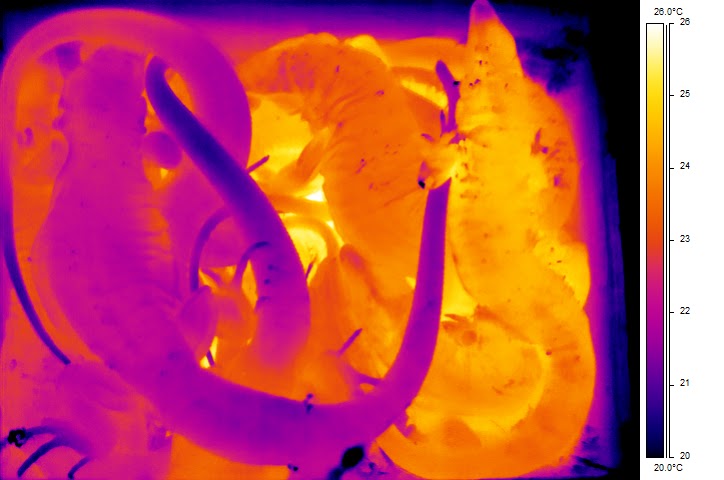
Here are the results of the study, depicted simply as a thermal image:

Shown above is a small group of tegu lizards sharing the same burrow (they do so voluntarily, although probably with a little “aggro”).  This image was captured in the early morning hours (~5-6am) before sunrise during the breeding season, so the tegus should have been as cold as they could be from the previous day of basking.  One is a little bit cooler than the other two in temperature, but all three are quite a bit warmer than their surroundings.  They are achieving this through a rise in metabolism and because of an escape from the outside air, are able to slow their rates of heat loss.

Indeed, occasionally, a tegu doesn’t make it back into the burrow at night, so that the next morning when we find it, it is quite frigid.  This is because the endothermy isn’t operating at the same capacity of that of a bird or mammal and that it is not necessarily thermoregulatory in nature.  Here is a rather cool tegu found trapped outside a burrow on a cool night (~6am), with a low body temperature:

Anyhow, what is more important for me to write about is something I only thought about after the media started calling us, and that is that not all science follows the painfully boring description kids are given in school about the laborious scientific method.  Allow me to explain by way of giving the “human side” to a fun research collaboration, while also writing this as a parable for the way that science truly proceeds.

The Best Laid Plans of Lizards and Men Often go Awry

This study began as a 2 year long MSc project for Colin Sanders, who was working with Dr. William Milsom at the University of British Columbia (where I did my post-doc).   Colin, Bill and myself went down to Brasil in 2003/2004 to initiate a project examining the year-long changes in heart rate, breathing rate and body temperature in tegu lizards in a semi-natural environment.  The initial basis for the study was to examine a lizard that would hibernate (i.e. go dormant) at relatively warm temperatures.  Our Brasilian colleagues (Abe and Andrade) had laboratory data suggesting that tegus would go dormant in the winter.  We had valid physiological reasons for why this was a interesting question (not initially about endothermy) and that was Colin’s MSc project.  How did we do this?  We implanted little electronic devices that would measure an EKG and EMG and body temperature continuously and save this data to a computer.  The entire project was instrument heavy and indeed, our equipment was tied up in Brazilian customs for 6 weeks, nearly preventing the launching of his research!  I wrote a Matlab script to analyse the massive amount of raw data we were collecting from the radio-transmitting telemeters.  Colin had to endure months of staring at the computer screen to verify the script was working properly.  All totalled, we collected Gigabytes of data to computers that had no DVD drives and no network access.  Suffice it to say, Colin had a lot of sleepless nights and frustrations of running my rather unsophisticated computer code.  Skype and email were our friends, but it made discovery a distant and future goal.

Fast forwarding to when Colin returned to Canada, he now had a massive amount of data on the daily changes in heart rate, breathing rates and body temperatures in a cohort of tegu lizards and still had to make sense of that.  In many ways, this project was a highly sophisticated Natural History project.  We were initially interested in knowing whether tegus went into their burrows and reduced metabolism in the winter and needed to do this under natural conditions, which is where our Brasilian colleagues came in.

Collaboration and Camaraderie

We were able to pursue this research because of the friendly and collaborative nature of two key individuals, Dr. Augusto Abe and Dr. Denis Andrade.  Since 2002, they have hosted myself in their lab (and homes!) for up to 1 or 2 months, almost on a yearly basis.  They both have interesting research programs into South American evolutionary physiology and comparative biology and are incredibly knowledgeable about the natural history of reptiles and amphibians of Brasil.  They had both studied tegu hibernation in the lab as well.  Not only was their lab designed to allow us to study tegus in their (almost) natural habitat, but visiting their labs is always a fruitful journey of discovery.  My hats off to Augusto for having the foresight to build a world class facility to encourage and foster collaborations in our discipline, and my deep appreciation to Denis for being the on-site “supervisor” of the research in Brasil.  It is not easy to remotely manage collaborations.

Check, Refine, Eliminate other Explanations

Following our initial, but unplanned-for observations of lizards warming up in the reproductive season, we spent a few years (yes, this was a slow cooker project) discussing the possible explanations and trying to devise ways to convince ourselves that the heat was due to metabolic heat production.  Colin’s heart rate data did provide the best evidence of this, but we already recognized that reviewers would be inherently skeptical, since we were ourselves.  At this stage, Dr. Cleo Leite and my student Viviana Cadena were invited to carry the torch and help provide the evidence that the tegus were not only capturing heat from the sun very efficiently and storing it.  Bill and myself had a lot of friendly arguments about this, but Bill convinced us all that the initial observations were real and important.  As a side project to his other research, Cleo collected three years worth of data on tegus during the reproductive period and transferring them back and forth from outside burrows to inside the lab where we had better control over ambient temperature, and along with Viviana’s thermal images, we were able to show that tegus were still showing rather impressive amount of endothermy (2 to 3 degrees above ambient temperature) when placed in the lab for a week without access to insulating burrows, or nest material.

Science is an Ongoing Learning Exercise

Along with wise and thoughtful contributions from all my co-authors, I was tasked with the unenviable job (hey, this is my story, so I can tell it this way) of writing the data up for publication.  All of us suffer from procrastination when it comes to writing.  Scientific writing is not simply formulaic, although there are clear and simple ways to present science accurately, I also think the best scientific papers also tell a story.  So, I drafted the first version of the manuscript and knew we had a really cool observation but had to do my homework since we would need to place the work into the appropriate theoretical context.  The evolution of endothermy has a long history of big thinkers testing hypotheses for how the ancestral condition of ectothermy could have overcome the energetic costs inherent to endothermy.  How were we to put our years of observations into this context?  Anyhow, I think we were all pushed a little outside our comfort zone.

Don’t Be Dismayed by Rejection

Once you think you have a potentially impactful paper, you do want it to be published somewhere where it will be read!  It also is true (almost a cliche) that many scientists will aim for the top journals, only to receive that dreaded auto-email reply from Nature claiming that “…your manuscript is of insufficient immediate interest to our broader readership to justify its publication in Nature.”  That is fine.  Push on and don’t let that manuscript stagnate on your computer.  So, that is what we did.  We endured our rejection, made headways with a subsequent submission and actually were pleased with the chance to have a widely publicised paper that was also available in an open access venue.

Take Home Message

Although the media attention surrounding discoveries are usually nice, they very often exaggerate the story and forget to comment on the importance of the team as well as the important role of accidental discovery.  Serendipity should be more valued in science.  It rarely is, and I worry that we train our students to become hypercritical hypothesis-driven automatons.  Although I still think that science should be hypothesis-driven (you still need to know what you hope to achieve and be able to communicate this effectively when writing a research grant or defending your idea to a graduate committee), you also need the freedom to “follow your nose” if you come across a novel observation.  Why can’t we have both?  Why can’t we train people to think scientifically, accurately and carefully, while recognizing the value of thinking outside dogmatic constraints.  Yet, granting agencies demand outcomes and outputs and governments like to link research to applications (read: commercial applications and jobs).  Where is the joy in this approach?  How does basic research fit into this?

My advice to junior scientists?  Don’t give up, but be prepared to think clearly and seek your motivation to do science (i.e. discovery research) from your own inner enthusiastic and curious kid, rather than your colleagues or your mentors!

Funding Agencies Deserve their Credit

There are some funding agencies that do value basic research, and my hats off to them!

This research was funded by the Natural Sciences and Engineering Research Council of Canada (to W.K.M. and G.J.T.),  FAPESP, and CNPq through the INCT in Comparative Physiology (proceeding nos. 2008/57712-4 and 573921/2008-3). D.V.A. was supported by research grants from the FAPESP (proceeding nos. 2010/05473-6 and 2013/04190-9) and CNPq.

Galapagos 2.0

Ramping up for the second field season in Galapagos, so I might start blogging a little more. It has taken a year to secure the permits and permission to conduct our research, so let’s hope the data are interesting! I will eventually post about the data, but perhaps not until the paper(s) is/are published. Fly out tomorrow morning….arrive in Galapagos on Thursday morning. Let’s hope that all my equipment arrives safely. Stay tuned…

BLISS-ful Spring

I’m taking a break from the usual blog entries to highlight a field-based research project that has been years in the making, but somehow part of my research interests. Another research hat that I wear is one related to a population monitoring project in Algonquin Park. It seems appropriate this year, given the long cold winter and late spring, to chronicle the history of this project now, given the length of the study and the hope for the future. It all starts with a small lake in Algonquin Park – Bat Lake. Bat Lake is a small lake in Algonquin Park, located just north of Highway 60. This lake is an unusual lake in that it is highly acidic (pH 4.3), fishless, rain/snow melt fed but permanent. This creates a unique combination for amphibians, since the lack of fish opens up opportunities for larval amphibians to survive and reproduce in abundance: nearly all of Algonquin Park’s amphibians breed in it every year, making it a microcosm of the amphibians. Here is a picture of Bat Lake:
P1050009
To call it a Lake is actually a bit of a misnomer. Technically, it is a spruce bog, whose chemistry and biology has likely remained reasonably static since it formed following the retreat of the most recent glaciers ~10,000 years ago. Core sample data going back for the past 200 years suggests it has been fishless for at least that long, indicating that the acidity is not due to industrialization but is due to the unique features of the bog and the underlying bedrock which bestows very little buffering capacity to the water. Of the amphibians that breed in Bat Lake, the one this ‘lake’ is best known for is the Spotted Salamander, Ambystoma maculatum. Every spring, thousands of salamanders embark on a migration (probably ~1-2 km) to this breeding site.

P1000037

History of the Bat Lake Inventory of Spotted Salamanders. (BLISS) The salamanders of Bat Lake have long been of interest to people familiar with Algonquin Park.

Pre 1990s – Numerous Algonquin Park Naturalists have helped to highlight the unique ecosystem at Bat Lake. It only takes a brief read of the Bat Lake Trail Guide to see the importance of salamanders to the surrounding ecosystem, where they are estimated to make up a large portion of the animal biomass.

1993 – I was first introduced to Bat Lake as an undergraduate student conducting a research project in the lab of Dr. Jim Bogart at the University of Guelph. I was not the best of research assistants and not much came of my work that summer (I am grateful to Jim for for his patience), but this little lake had a large influence on my thinking as a biologist.

1994 – 2006: Through the initiatives of Ron Brooks and the MNR, Bat Lake was included among other lakes in Algonquin Park for egg mass counts.

2004 – 2007: My lab began a series of studies on the symbiosis between the embryonic salamander and a algae that grows within the egg capsule. See here and here.

2008: My lab started formal Spotted Salamander monitoring at Bat Lake, referring to the project as BLISS. Aptly named, it turns out, since the students who tend to gravitate toward the project find working at Bat Lake a blissful experience! At least if they like working with herps.

2008 – 2012: The initial years of BLISS have worked out the ‘bugs’ of starting a field project in a remote part of Ontario far from where we all live. Various students have taken part over the years, including David LeGros, Patrick Moldowan, and Sean Boyle, all of whom I am proud to note have gone onto bigger and better things. Let’s hope they become the next generation’s biologists!

Present day: BLISS is currently co-managed by Algonquin Park Biologist, Jennifer Hoare, operationally run by Patrick Moldowan, with data deposited and analyzed by me (Glenn Tattersall). I feel sad that I am not more involved, but I have yet to manage to clone myself to allow me to get into the field in the springtime. Back in my lab at Brock, May is usually one of the busiest times of year as new students are starting research projects, and conference season is in full swing. Maybe one year I will actually get to experience the BLISS that is working in the field catching salamanders.

Into the future: The plan is for BLISS to remain a cooperative venture between the Ministry of Natural Resources/Ontario Parks, Universities, passionate biologists, and supported by volunteers! Check out this blog from Ontario parks showing their support for our project, as well as a creative writing impression (written by Patrick Moldowan) of what it is like to be a herpetologist anticipating the most exciting time of year: Spring!!

I hope to begin to write up some interesting results from BLISS in the next year or two, and will be happy to discuss questions with interested colleagues. So far, we are obtaining informative trends and associations between egg mass abundance and adult body size and changes in previous year’s climate. The trick with a long-term dataset is how long to wait before publishing the results!

Of course, BLISS would not be possible without the Algonquin Wildlife Research Station and all the researchers who have made this place what it is. Check out their website for more information, but in short, this research station is primarily operated by dedicated university researchers who pursue research into Wildlife in the boreal forests of Ontario. Many Ontario university undergraduates have sunk their teeth into research at this station and fallen in love with science and the outdoors. Since federal funding for basic sciences is under threat, all field stations need support from the public, so please consider donating.

Happy Spring Everyone!

IMG 4761